© 2022 Exneyder A. Montoya-Araque, Daniel F. Ruiz and Universidad EAFIT.
This notebook can be interactively run in Google - Colab.
This notebook runs pyCSS by Suarez-Borgoa & Montoya-Araque (2016); credits to aarizat for the first PyPI package release (v0.1.0). Users can also access the original release asocciated with the publication, and the Spanish-version manual.
pyCSS

Required modules and initial setup
import pandas as pd
import numpy as np
import matplotlib.pyplot as plt
import matplotlib as mpl
import time
from shapely.geometry import Polygon, LineString
from ipywidgets import interact, widgets

from ipywidgets import widgets as wgt
from IPython import get_ipython
from IPython.display import display

if 'google.colab' in str(get_ipython()):
    print('Running on CoLab. Installing the required modules...')
    from subprocess import run
    # run('pip install ipympl', shell=True);
    run('pip install pycss-lem', shell=True);
    from google.colab import output
    output.enable_custom_widget_manager()

from pycss_lem import get_fos, get_min_fos

%matplotlib inline
mpl.rcParams.update({
    "font.family": "serif",
    "font.serif": ["Computer Modern Roman", "cmr", "cmr10", "DejaVu Serif"],  # or
    "mathtext.fontset": "cm",  # Use Computer Modern fonts for math
    "axes.formatter.use_mathtext": True,  # Use mathtext for axis labels
    "axes.unicode_minus": False,   # Use standard minus sign instead of a unicode character
})projectName = "Slope stability class at EAFIT"
projectAuthor = "EAFIT"
projectDate = time.strftime("%d/%m/%y") # Automatic dateSlope geometry
slopeHeight = [5, 'm']
slopeDip = [1.5, 1.0]
crownDist = [10, 'm']
toeDist = [5, 'm']
wantAutomaticToeDepth = False
toeDepth = [5, 'm']
Watertable
wantWatertable = True
wtDepthAtCrown = [4.0, 'm']
toeUnderWatertable = False
Materials properties
waterUnitWeight = [9.8, 'kN/m3']
materialUnitWeight = [17, 'kN/m3']
frictionAngleGrad = [27, 'degrees']
cohesion = [5, 'kPa']
Advanced inputs
wantConstSliceWidthTrue = True
numSlices = 15 # Number of discretizations of slip surface
nDivs = numSlices # Number of discretizations of circular arcs
methodString = 'Allm' # Select the method to calcualte Fs ['Flns', 'Bshp' or 'Allm']
# Select the output format image
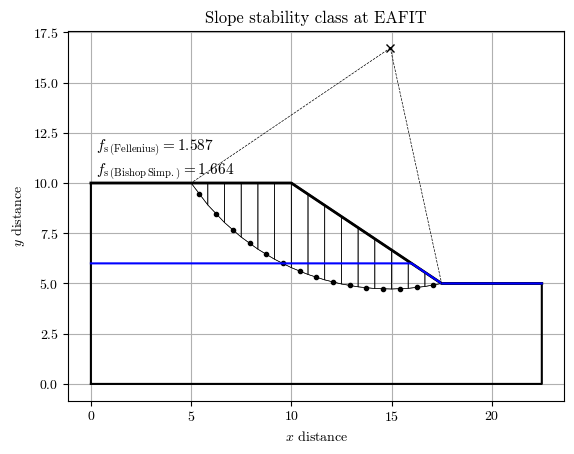
outputFormatImg = '.svg' # ['.eps', '.jpeg', '.jpg', '.pdf', '.pgf', '.png', '.ps', '.raw', '.rgba', '.svg', '.svgz', '.tif', '.tiff']Assessment of a single potential circular failure surface
Geomoetry of the circular failure surface
hztDistPointAtCrownFromCrown = [-5, 'm']
hztDistPointAtToeFromCrown = [7.5, 'm']
slipRadius = [12, 'm']
Running stability analysis
msg = get_fos(
    projectName,
    projectAuthor,
    projectDate,
    slopeHeight,
    slopeDip,
    crownDist,
    toeDist,
    wantAutomaticToeDepth,
    toeDepth,
    hztDistPointAtCrownFromCrown,
    hztDistPointAtToeFromCrown,
    slipRadius,
    wantWatertable,
    wtDepthAtCrown,
    toeUnderWatertable,
    waterUnitWeight,
    materialUnitWeight,
    frictionAngleGrad,
    cohesion,
    wantConstSliceWidthTrue,
    numSlices,
    nDivs,
    methodString,
    outputFormatImg
)
fig = plt.gcf()
# fig.set_size_inches(18.5, 10.5)
Analysis successfully performed!
Assessment of a multiple potential circular failure surface for getting the minimum 
Additional inputs to control how multiple surfaces are generated and evaluated
numSlices = 15  # Number of discretizations of slip surface
numCircles = 500  # Number of surfaces to assess
radiusIncrement = [3, 'm']  # Length of radius increment
numberIncrements = 5  # Number of radius increment
maxFsValueCont = 3  # Mask to plot fs at screen
Running stability analysis
# %matplotlib inline
get_min_fos(
    projectName,
    projectAuthor,
    projectDate,
    slopeHeight,
    slopeDip,
    crownDist,
    toeDist,
    wantAutomaticToeDepth,
    toeDepth,
    numCircles,
    radiusIncrement,
    numberIncrements,
    maxFsValueCont,
    wantWatertable,
    wtDepthAtCrown,
    toeUnderWatertable,
    waterUnitWeight,
    materialUnitWeight,
    frictionAngleGrad,
    cohesion,
    wantConstSliceWidthTrue,
    numSlices,
    nDivs,
    methodString,
    outputFormatImg,
)
fig = plt.gcf()
# fig.set_size_inches(18.5, 10.5)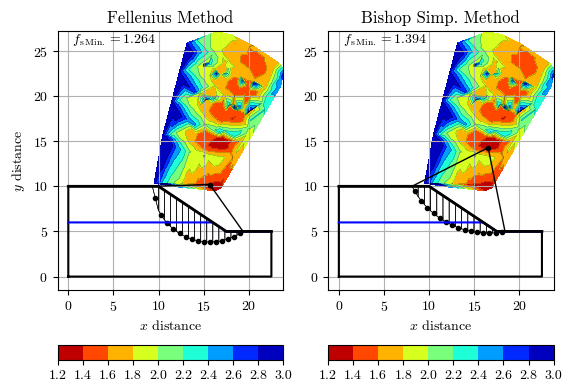
- Suarez-Borgoa, L. O., & Montoya-Araque, E. A. (2016). Programa en código abierto para el análisis bidimensional de estabilidad de taludes por el método de equilibrio límite. Revista de La Facultad de Ciencias, 5(2), 88–104. 10.15446/rev.fac.cienc.v5n2.59914