Rainfall as a triggering factor in a spatial domain#
© 2024 Daniel F. Ruiz, Exneyder A. Montoya-Araque y Universidad EAFIT.
This notebook can be interactively run in Google - Colab.
This notebook runs the model TRIGRS (Transient Rainfall Infiltration and Grid-Based Regional Slope-Stability Analysis), developed by Baum et al. [2002] and Baum et al. [2008], and parallelized later by Alvioli and Baum [2016]
Required modules and global setup for plots#
import os
import subprocess
import textwrap
import itertools
import requests

import numpy as np
import pandas as pd
import matplotlib.pyplot as plt
import matplotlib as mpl
from IPython import get_ipython

if 'google.colab' in str(get_ipython()):
    print('Running on CoLab. Installing the required modules...')
    # subprocess.run('pip install ipympl', shell=True);
    subprocess.run('pip install palettable', shell=True);
    subprocess.run('pip install pynewmarkdisp', shell=True);
    from google.colab import output, files
    output.enable_custom_widget_manager()

else:
    import tkinter as tk
    from tkinter.filedialog import askopenfilename

from pynewmarkdisp.spatial import get_hillshade

# Figures setup
# %matplotlib widget
%matplotlib inline

mpl.rcParams.update({
    "font.family": "serif",
    "font.serif": ["Computer Modern Roman", "cmr", "cmr10", "DejaVu Serif"],  # or
    "mathtext.fontset": "cm",  # Use Computer Modern fonts for math
    "axes.formatter.use_mathtext": True,  # Use mathtext for axis labels
    "axes.unicode_minus": False,   # Use standard minus sign instead of a unicode character
})
Creating directories#
# Create a folder called TRIGRS in the current working directory if it doesn't exist
workdir = os.getcwd()
exec_dir = os.path.join(workdir, "TRIGRS_2")
os.makedirs(f"{exec_dir}", exist_ok=True)

# Create a folder inside TRIGRS to store the ascii files
inputs_dir = os.path.join(exec_dir, "inputs")
outputs_dir = os.path.join(exec_dir, "outputs")
os.makedirs(f"{inputs_dir}", exist_ok=True)
os.makedirs(f"{outputs_dir}", exist_ok=True)
Functions#
def tpx_in_maker(tpx_inputs):
    tpx_in_template = textwrap.dedent(
        f"""\
        TopoIndex 1.0.15; Name of project (up to 255 characters)
        TopoIndex analysis - Project: {tpx_inputs["proj_name"]}
        Flow-direction numbering scheme (ESRI=1, TopoIndex=2)
        {tpx_inputs["flow_dir_scheme"]}
        Exponent, Number of iterations
        {tpx_inputs["exponent_weight_fact"]}, {tpx_inputs["iterarions"]}
        Name of elevation grid file
        TRIGRS_2/inputs/dem.asc
        Name of direction grid
        TRIGRS_2/inputs/directions.asc
        Save listing of D8 downslope neighbor cells (TIdsneiList_XYZ)?  Enter T (.true.) or F (.false.)
        T
        Save grid of D8 downslope neighbor cells (***TIdscelGrid_XYZ)? Enter T (.true.) or F (.false.)
        T
        Save cell index number grid (TIcelindxGrid_XYZ)?  Enter T (.true.) or F (.false.)
        T
        Save list of cell number and corresponding index number (***TIcelindxList_XYZ)? Enter T (.true.) or F (.false.)
        T
        Save flow-direction grid remapped from ESRI to TopoIndex (TIflodirGrid_XYZ)? Enter T (.true.) or F (.false.)
        T
        Save grid of points on ridge crests (TIdsneiList_XYZ)? Enter T (.true.) or F (.false.); Sparse (T) or dense (F)?
        F,T
        ID code for output files? (8 characters or less)
        {tpx_inputs["proj_name"]}"""
    )
    with open("tpx_in.txt", "w") as file:
        file.write(tpx_in_template)
    return


def run_topoidx(tpx_inputs):
    tpx_in_maker(tpx_inputs)  # Generating initializing files
    subprocess.call(["chmod +x ./TRIGRS_2/Exe_TopoIndex"], shell=True)  # Change permission
    subprocess.call(["./TRIGRS_2/Exe_TopoIndex"])  # Running Fortran executable
    # Moving log file to outputs folder and renaming it
    os.rename(os.path.join(workdir, "TopoIndexLog.txt"), os.path.join(outputs_dir, f"TopoIndexLog_{tpx_inputs['proj_name']}.txt"))
    os.rename(os.path.join(workdir, "tpx_in.txt"), os.path.join(exec_dir, f"tpx_in_{tpx_inputs['proj_name']}.txt"))
    return


def tr_in_maker(trg_inputs):
    # Create text block for geotechnical parameters of each zone
    geoparams = ""
    for zone in trg_inputs["geoparams"].keys():
        z = trg_inputs["geoparams"][zone]
        txt_zone = "".join(
            [
                f"zone, {zone}\n",
                "cohesion, phi, uws, diffus, K-sat, Theta-sat, Theta-res, Alpha\n",
                f'{z["c"]}, {z["φ"]}, {z["γ_sat"]}, {z["D_sat"]}, {z["K_sat"]}, {z["θ_sat"]}, {z["θ_res"]}, {z["α"]}\n',
            ]
        )
        # print(txt_zone)
        geoparams = str().join([geoparams, txt_zone])
    # Update rifil entry with placeholder for each file
    trg_inputs["rifil"] = str().join(
        [f"TRIGRS_2/inputs/ri{n}.asc\n" for n in range(1, len(trg_inputs["capt"]))]
    )

    # Template
    trg_in_template = (
        textwrap.dedent(
            f"""\
        Project: {trg_inputs['proj_name']}
        TRIGRS, version 2.1.00c, (meter-kilogram-second-degrees units)
        tx, nmax, mmax, zones
        {trg_inputs['tx']}, {trg_inputs['nmax']}, {trg_inputs['mmax']}, {trg_inputs['zones']}
        nzs, zmin, uww, nper t
        {trg_inputs['nzs']}, 0.001, 9.8e3, {trg_inputs['nper']}, {trg_inputs['t']}
        zmax, depth, rizero, Min_Slope_Angle (degrees), Max_Slope_Angle (degrees)
        {trg_inputs['zmax']}, {trg_inputs['depth']}, {trg_inputs['rizero']}, 0., 90.0
        """
        )
        + geoparams[:-1]
        + textwrap.dedent(
            f"""
        cri(1), cri(2), ..., cri(nper)
        {', '.join(map(str, trg_inputs['cri']))}
        capt(1), capt(2), ..., capt(n), capt(n+1)
        {', '.join(map(str, trg_inputs['capt']))}
        File name of slope angle grid (slofil)
        TRIGRS_2/inputs/slope.asc
        File name of digital elevation grid (elevfil)
        TRIGRS_2/inputs/dem.asc
        File name of property zone grid (zonfil)
        TRIGRS_2/inputs/zones.asc
        File name of depth grid (zfil)
        TRIGRS_2/inputs/zmax.asc
        File name of initial depth of water table grid   (depfil)
        TRIGRS_2/inputs/depthwt.asc
        File name of initial infiltration rate grid   (rizerofil)
        TRIGRS_2/inputs/rizero.asc
        List of file name(s) of rainfall intensity for each period, (rifil())
        """
        )
        + trg_inputs["rifil"][:-2]
        + textwrap.dedent(
            f"""
        File name of grid of D8 runoff receptor cell numbers (nxtfil)
        TRIGRS_2/inputs/TIdscelGrid_{trg_inputs['proj_name']}.txt
        File name of list of defining runoff computation order (ndxfil)
        TRIGRS_2/inputs/TIcelindxList_{trg_inputs['proj_name']}.txt
        File name of list of all runoff receptor cells  (dscfil)
        TRIGRS_2/inputs/TIdscelList_{trg_inputs['proj_name']}.txt
        File name of list of runoff weighting factors  (wffil)
        TRIGRS_2/inputs/TIwfactorList_{trg_inputs['proj_name']}.txt
        Folder where output grid files will be stored  (folder)
        TRIGRS_2/outputs/
        Identification code to be added to names of output files (suffix)
        {trg_inputs['proj_name']}
        Save grid files of runoff? Enter T (.true.) or F (.false.)
        F
        Save grid of minimum factor of safety? Enter T (.true.) or F (.false.)
        T
        Save grid of depth of minimum factor of safety? Enter T (.true.) or F (.false.)
        T
        Save grid of pressure head at depth of minimum factor of safety? Enter T (.true.) or F (.false.)
        T
        Save grid of computed water table depth or elevation? Enter T (.true.) or F (.false.) followed by 'depth,' or 'eleva'
        T, depth
        Save grid files of actual infiltration rate? Enter T (.true.) or F (.false.)
        F
        Save grid files of unsaturated zone basal flux? Enter T (.true.) or F (.false.)
        F
        Save listing of pressure head and factor of safety ("flag")? (-9 sparse xmdv , -8 down-sampled xmdv, -7 full xmdv, -6 sparse ijz, -5 down-sampled ijz, -4 full ijz, -3 Z-P-Fs-saturation list -2 detailed Z-P-Fs, -1 Z-P-Fs list, 0 none). Enter flag value followed by down-sampling interval (integer).
        {trg_inputs['ψ_flag']}, {trg_inputs['nzs']}
        Number of times to save output grids and (or) ijz/xmdv files
        {trg_inputs['n_outputs']}
        Times of output grids and (or) ijz/xmdv files
        {', '.join(map(str, trg_inputs['t_n_outputs']))}
        Skip other timesteps? Enter T (.true.) or F (.false.)
        F
        Use analytic solution for fillable porosity?  Enter T (.true.) or F (.false.)
        T
        Estimate positive pressure head in rising water table zone (i.e. in lower part of unsat zone)?  Enter T (.true.) or F (.false.)
        T
        Use psi0=-1/alpha? Enter T (.true.) or F (.false.) (False selects the default value, psi0=0)
        F
        Log mass balance results?   Enter T (.true.) or F (.false.)
        T
        Flow direction (Enter "gener", "slope", or "hydro")
        {trg_inputs['flowdir']}
        Add steady background flux to transient infiltration rate to prevent drying beyond the initial conditions during periods of zero infiltration?
        T
        Specify file extension for output grids. Enter T (.true.) for ".asc" or F for ".txt"
        T
        Ignore negative pressure head in computing factor of safety (saturated infiltration only)?   Enter T (.true.) or F (.false.)
        T
        Ignore height of capillary fringe in computing pressure head for unsaturated infiltration option?   Enter T (.true.) or F (.false.)
        T
        Parameters for deep pore-pressure estimate in SCOOPS ijz output: Depth below ground surface (positive, use negative value to cancel this option), pressure option (enter 'zero' , 'flow' , 'hydr' , or 'relh')
        -50.0,flow
        """
        )
    )
    # Create txt file
    with open("tr_in.txt", "w") as file:
        file.write(trg_in_template)
    return


def run_trigrs(trg_inputs):
    # Correcting sign for `Alpha` parameters for saturated/unsaturated models
    for z in trg_inputs["geoparams"].keys():
        zone = trg_inputs["geoparams"][z]
        if "S" in trg_inputs["model"]:
            zone["α"] = -1 * abs(zone["α"])
        else:
            zone["α"] = abs(zone["α"])

    # Correcting sign for `mmax` parameters for finite/infinite models
    if "I" in trg_inputs["model"]:
        trg_inputs["mmax"] = -1 * abs(trg_inputs["mmax"])
    else:
        trg_inputs["mmax"] = abs(trg_inputs["mmax"])

    # Generating initializing file and running TRIGRS executable
    tr_in_maker(trg_inputs)  # Initializing files from template
    if trg_inputs["parallel"]:
        exe = "./TRIGRS_2/Exe_TRIGRS_par"
        subprocess.call([f"chmod +x {exe}"], shell=True)  # Change permission
        subprocess.call(
            [f'mpirun -np {trg_inputs["NP"]} {exe}'], shell=True
        )  # Running TRIGRS executable
    else:
        exe = "./TRIGRS_2/Exe_TRIGRS_ser"
        subprocess.call([f"chmod +x {exe}"], shell=True)  # Change permission
        subprocess.call([exe], shell=True)  # Running TRIGRS executable

    # Moving files to output folders and renaming it
    proj_name, model = trg_inputs["proj_name"], trg_inputs["model"]
    os.rename(os.path.join(workdir, "TrigrsLog.txt"), os.path.join(outputs_dir, f"TrigrsLog_{proj_name}_{model}.txt"))
    os.rename(os.path.join(workdir, "tr_in.txt"), os.path.join(exec_dir, f"tr_in_{proj_name}_{model}.txt"))
    groups = (
        "TRfs_min",
        "TRp_at_fs_min",
        "TRwater_depth",
        "TRz_at_fs_min",
        "TR_ijz_p_th",
        # "TRrunoffPer",
    )
    [os.makedirs(f"TRIGRS_2/outputs/{grp}", exist_ok=True) for grp in groups]
    idx = np.arange(1, trg_inputs["n_outputs"] + 1, 1)
    for grp, i in itertools.product(groups, idx):
        if grp == "TRrunoffPer":
            os.rename(
                f"TRIGRS_2/outputs/{grp}{i}{proj_name}.asc",
                f"TRIGRS_2/outputs/{grp}/{grp}_{proj_name}_{model}_{i}.asc",
            )
        elif grp == "TR_ijz_p_th":
            os.rename(
                f"TRIGRS_2/outputs/{grp}_{proj_name}_{i}.txt",
                f"TRIGRS_2/outputs/{grp}/{grp}_{proj_name}_{model}_{i}.txt",
            )
        else:
            os.rename(
                f"TRIGRS_2/outputs/{grp}_{proj_name}_{i}.asc",
                f"TRIGRS_2/outputs/{grp}/{grp}_{proj_name}_{model}_{i}.asc",
            )
    return


def get_param(zone, param):
    return trg_inputs['geoparams'][zone.iloc[0]][param]

def get_df(file):
    γ_w = 9.8e3  # [N/m3] unit weight of water
    # Reading file
    df = pd.read_csv(file,
                     names=['i_tr', 'j_tr', 'elev', 'ψ', 'θ'],
                     skiprows=7, sep='\s+')#delim_whitespace=True)
    # Correcting indices to match numpy notation
    df['i'] = df['j_tr'].max() - df['j_tr']
    df['j'] = df['i_tr'] - 1
    df.drop(columns=['i_tr', 'j_tr'], inplace=True)
    # Calculating depths from elevations
    elev_max = df.groupby(['i', 'j'])['elev'].transform('max')
    df['z'] = elev_max - df['elev'] + 0.001
    df = df[['i', 'j', 'elev', 'z', 'ψ', 'θ']]
    # Assigning zones and geotechnical parameters
    df['zone'] = zones[df['i'], df['j']]
    for param_name in trg_inputs['geoparams'][1].keys():
        df[param_name] = df.groupby('zone')['zone'].transform(
            get_param, param=param_name)
    # Correting rows with ψ==0 (watertable) due to numerical errors
    mask = (df['ψ'] == 0) & (df['z'] > 0.001) & (df['θ'] == df['θ_sat'])
    # df.loc[mask, 'z'] = df.loc[mask, 'z'] + 1/df.loc[mask, 'α']
    # df.loc[mask, 'elev'] = df.loc[mask, 'elev'] - 1/df.loc[mask, 'α']
    # df.sort_values(['i', 'j', 'z'], inplace=True)
    df.drop(df[mask].index, inplace=True)  # This eliminates the wt rows
    # Assigning slope
    df['δ'] = slope[df['i'], df['j']]
    δrad = np.deg2rad(df['δ'])
    # Calculating effective stress parameter, χ
    df['χ'] = (df['θ'] - df['θ_res']) / (df['θ_sat'] - df['θ_res'])
    # Specific gravity
    df['Gs'] = (df['γ_sat']/γ_w - df['θ_sat']) / (1 - df['θ_sat'])
    # unit weight at unsat and sat zones
    df['γ_nat'] = (df['Gs'] * (1 - df['θ_sat']) + df['θ']) * γ_w
    # average unit weight
    γ_cumul = df.groupby(['i', 'j'])['γ_nat'].transform('cumsum')
    idx = df.groupby(['i', 'j'])['γ_nat'].cumcount() + 1
    df['γ_avg'] = γ_cumul / idx
    # Factor of safety
    fs1 = np.tan(np.deg2rad(df['φ'])) / np.tan(δrad)
    fs2_num = df['c'] - df['ψ'] * γ_w * df['χ'] * np.tan(np.deg2rad(df['φ']))
    fs2_den = df['γ_avg'] * df['z'] * np.sin(δrad) * np.cos(δrad)
    fs = fs1 + fs2_num/fs2_den
    fs[fs > 3] = 3
    df['fs'] = fs
    return df
Loading executables and input files#
def download_file_from_github(file, url_path, output_path, make_executable=False):
    os.makedirs(output_path, exist_ok=True)
    destination = os.path.join(output_path, file)

    # ✅ Check if file already exists
    if os.path.exists(destination):
        print(f"🟡 File already exists at: {destination} — skipping download.")
        return

    url = f"{url_path.rstrip('/')}/{file}"

    try:
        print(f"⬇️ Downloading from: {url}")
        subprocess.run(["wget", "-q", "-O", destination, url], check=True)

        if make_executable:
            os.chmod(destination, 0o755)
            print(f"🔧 File marked as executable.")

        print(f"✅ File downloaded to: {destination}")
    except subprocess.CalledProcessError as e:
        print(f"❌ Download failed: {e}")


url_path = "https://raw.githubusercontent.com/eamontoyaa/data4testing/main/trigrs/"  # URL of the raw file on GitHub
output_path = "./TRIGRS_2/"  # Path where you want to save the downloaded file
TopoIndex#
file = "Exe_TopoIndex"  # Name of the file to download
download_file_from_github(file, url_path, output_path)
⬇️ Downloading from: https://raw.githubusercontent.com/eamontoyaa/data4testing/main/trigrs/Exe_TopoIndex
✅ File downloaded to: ./TRIGRS_2/Exe_TopoIndex
TRIGRS#
file = "Exe_TRIGRS_ser"  # Name of the file to download
download_file_from_github(file, url_path, output_path)
⬇️ Downloading from: https://raw.githubusercontent.com/eamontoyaa/data4testing/main/trigrs/Exe_TRIGRS_ser
✅ File downloaded to: ./TRIGRS_2/Exe_TRIGRS_ser
# Check the files in the executables folder
os.listdir(exec_dir)
['Exe_TopoIndex', 'outputs', 'Exe_TRIGRS_ser', 'inputs']
Running the TRIGRS model for a one-cell spatial domain#
General inputs#
proj_name = "SPATIAL"
model = "SI"  # Choose among UF, UI, SF, SI → | U: unsaturated | S: saturated | F: finite | I: infinite |
rainfall_int =  np.array([3.e-7, 9.e-5])  # [m/s]
# rainfall_int =  np.array([0.5e-4, 0.5e-4])  # [m/s]
cumul_duration = np.array([0, 172800, 216000]) # [s]  Always starts at 0 and contains n+1 elements, where n is the number of rainfall intensities values
output_times = np.array([0.01, 43200, 86400, 100800, 183600, 216000]) # [s]  It does not have to include the same values as cumul_duration
Creating .asc files#
def load_ascii_raster(path, dtype=None):
    raster = np.loadtxt(path, skiprows=6)
    header = np.loadtxt(path, max_rows=6, dtype=object)
    header = {
        "ncols": int(header[0, 1]),
        "nrows": int(header[1, 1]),
        "xllcorner": float(header[2, 1]),
        "yllcorner": float(header[3, 1]),
        "cellsize": float(header[4, 1]),
        "nodata_value": eval(header[5, 1]),
    }
    raster[np.where(raster == header["nodata_value"])] = np.nan
    raster = raster.astype(dtype) if dtype is not None else raster
    return (raster, header)


def get_asc_from_url(file_name):
    base_url = "https://raw.githubusercontent.com/eamontoyaa/data4testing/main/trigrs/tutorial_data"
    url = f"{base_url}/{file_name}.asc"
    output_path = os.path.join(inputs_dir, f"{file_name}.asc")

    if os.path.exists(output_path):
        print(f"🟡 {file_name}.asc already exists at {output_path} — skipping download.")
        return

    try:
        subprocess.run(["wget", "-q", "-O", output_path, url], check=True)
        print(f"✅ {file_name}.asc downloaded successfully.")
    except subprocess.CalledProcessError:
        print(f"❌ Failed to download {file_name}.asc from {url}")

for file in ['dem', 'zmax', 'depthwt', 'slope', 'directions', 'rizero', 'zones']:
    get_asc_from_url(file)
✅ dem.asc downloaded successfully.
✅ zmax.asc downloaded successfully.
✅ depthwt.asc downloaded successfully.
✅ slope.asc downloaded successfully.
✅ directions.asc downloaded successfully.
✅ rizero.asc downloaded successfully.
✅ zones.asc downloaded successfully.
Note:
If you are loading locally your own spatial input data, rerun the notebook from this point.
dem, header = load_ascii_raster(f"{inputs_dir}/dem.asc")
slope, header = load_ascii_raster(f"{inputs_dir}/slope.asc")
directions, header = load_ascii_raster(f"{inputs_dir}/directions.asc")
zones, header = load_ascii_raster(f"{inputs_dir}/zones.asc")
depth, header = load_ascii_raster(f"{inputs_dir}/zmax.asc")
depth, header = load_ascii_raster(f"{inputs_dir}/rizero.asc")
depth_w, header = load_ascii_raster(f"{inputs_dir}/depthwt.asc")
# Running TopoIndex
tpx_inputs = {
    "flow_dir_scheme": 2,
    "exponent_weight_fact": 25,
    "iterarions": 10,
    "proj_name": proj_name,
}
run_topoidx(tpx_inputs)
   TopoIndex: Topographic Indexing and
  flow distribution factors for routing
  runoff through Digital Elevation Models
             By Rex L. Baum
        U.S. Geological Survey
      Version 1.0.14, 11May2015
 -----------------------------------------

 TopoIndex analysis - Project: SPATIAL
         100  = number of data cells
         100  = total number of cells
 Reading elevation grid data
 Initial elevation indexing completed
 Finding D8 neighbor cells
 nxtcel() nodata (integer,floating)=        -9999  -9999.00000
 Identifying downslope cells and grid mismatches
 No grid mismatch found!
 Correcting cell index numbers
 Computing weighting factors
 Saving results to disk
trg_inputs = {
    "proj_name": proj_name,  # Name of the project
    "model": model,  # S-saturated or U-unsaturated + F-finite or I-infinite
    "tx": 20, # [] tx*nper determines how many time steps are used in the computations
    "nmax": 30,  # [] Ma number of roots 𝚲n and terms in series solutions for UNS.zone
    "mmax": 100,  # [] Max number of terms in series solution for FIN depth. If <0: INF depth
    "zones": 2,  # [] Number of zones
    "nzs": 20,  # [] Vertical increments until zmax
    "nper": len(rainfall_int),  # [-] Periods of rainfall (N)
    "t": cumul_duration[-1],  # [s] Elapsed time since the start of the storm (t)
    "zmax": -3.001,  # [m] Max. depth to compute Fs and Ψ (if <0 read from grid file)
    "depth": -2.4,  # [m] Water table depth (d) (if <0 read from grid file)
    "rizero": -1e-9,  # [m/s] Steady pre-storm and long-term infilt. (Izlt) (if <0 read from grid file)
    "geoparams":{
        1: {
            "c": 3.5e3,  # [Pa] soil cohesion for effective stress (c')
            "φ": 35,  # [deg] soil friction angle for effective stress (φ')
            "γ_sat": 22.0e3,  # [N/m3]  unit weight of soil (γs)
            "D_sat": 6.0e-6,  # [m2/s] Saturated hydraulic diffusivity (D0)
            "K_sat": 1.0e-7,  # [m/s] Saturated hydraulic conductivity (Ks)
            "θ_sat": 0.45,  # [-] Saturated water content (θs)
            "θ_res": 0.05,  # [-] Residual water content (θr)
            "α": 0.5,  # [1/m] Fitting parameter. If <0: saturated infiltration
        },
        2: {
            "c": 8e3,  # [Pa] soil cohesion for effective stress (c')
            "φ": 31,  # [deg] soil friction angle for effective stress (φ')
            "γ_sat": 22.0e3,  # [N/m3]  unit weight of soil (γs)
            "D_sat": 8.0e-4,  # [m2/s] Saturated hydraulic diffusivity (D0)
            "K_sat": 1.0e-4,  # [m/s] Saturated hydraulic conductivity (Ks)
            "θ_sat": 0.45,  # [-] Saturated water content (θs)
            "θ_res": 0.06,  # [-] Residual water content (θr)
            "α": 8,  # [1/m] Fitting parameter. If <0: saturated infiltration
        }
    },
    "cri": tuple(rainfall_int),  # [m/s] Rainfall intensities  (Inz)
    "capt": tuple(cumul_duration),  # [s] Cumulative duration of rainfall cri[i]
    "flowdir": "gener",  # Method for maximum allowed Ψ ("gener", "slope", or "hydro"))
    "n_outputs": len(output_times),  # [-] No of raster outputs at different t
    "t_n_outputs": tuple(output_times),#t,  # [s] Time at which to save raster files
    "ψ_flag": -4,
    "parallel": False,  # [-] Run in parallel
    "NP" : 4, # Number of processors
    # "inz_n_outputs": inz_n_outputs #inz,  # [s] Rainfall intensities at which to save raster files
}

run_trigrs(trg_inputs)
 TRIGRS: Transient Rainfall Infiltration
 and Grid-based Regional Slope-Stability
                Analysis
        Version 2.1.00c, 02 Feb 2022
   By Rex L. Baum and William Z. Savage
        U.S. Geological Survey
 -----------------------------------------

 Opening default initialization file
 TRIGRS, version 2.1.00c, (meter-kilogram-second-degrees units)
 Negative or zero value of Alpha for property zone           1
 Saturated infiltration model will be used for cells in zone           1 .
 Negative or zero value of Alpha for property zone           2
 Saturated infiltration model will be used for cells in zone           2 .
 ******** Zone            1  *********
 Using saturated infiltration model to avoid
 early-time errors in unsaturated infiltration model.
 ******** Zone            2  *********
 Using saturated infiltration model to avoid
 early-time errors in unsaturated infiltration model.
 ********  ********  ********  *********
 TRIGRS_2/inputs/TIgrid_size.txt T
 Reading input grids
 Testing and adjusting steady infiltration rates
 Adjusted steady infiltration rate at            0  cells
 Starting runoff-routing computations
 Initial size of time-steps    5400.0000000000000
 ******** Output times ********
 number, timestep #,  time
 One or more specified output times unavailable,
 Nearest available time substituted.
           1           1   0.00000000
 One or more specified output times unavailable,
 Nearest available time substituted.
           2           6   43200.0000
 One or more specified output times unavailable,
 Nearest available time substituted.
           3          11   86400.0000
 One or more specified output times unavailable,
 Nearest available time substituted.
           4          12   95040.0000
 One or more specified output times unavailable,
 Nearest available time substituted.
           5          26   183600.000
 One or more specified output times unavailable,
 Nearest available time substituted.
           6          41   216000.000
 Starting computations of pressure head and factor of safety
 Ignoring unsaturated zone
 Calling multistep saturated infinite-depth model
 Starting computations
 for infinite-depth saturated zone
 Cells completed:
           0
         100  cells completed
 Saving results
 TRIGRS finished!
STOP 0
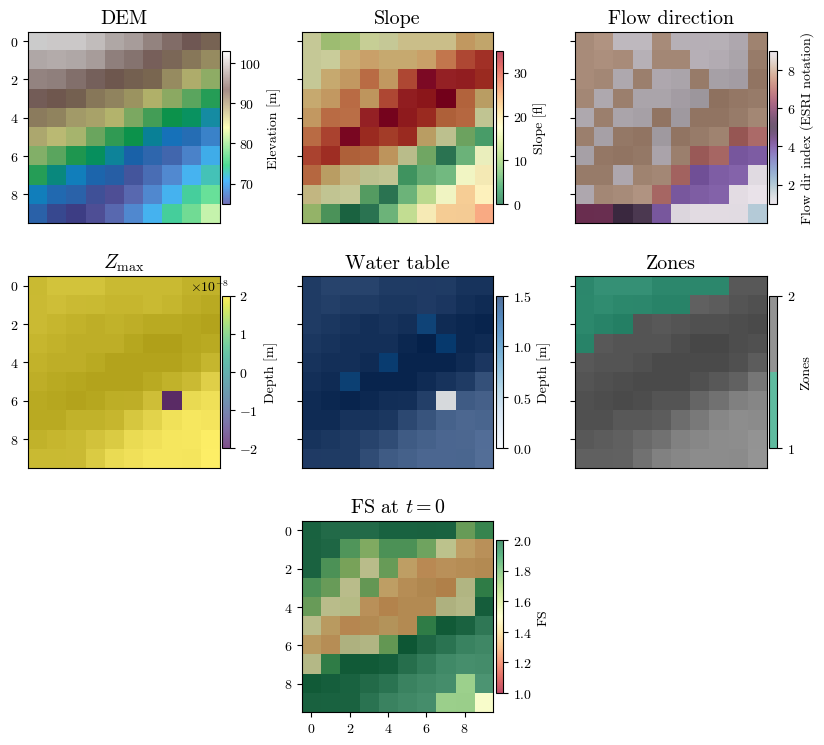
Visualizing spatial inputs (conditioning factors)#
hsd = get_hillshade(dem, sun_azimuth=000, sun_altitude=30, cellsize=header['cellsize'])

fig, axs = plt.subplot_mosaic([['a', 'b', 'c'], ['d', 'e', 'f'], ['.', 'g', '.']],
                              figsize=(10, 3*3), sharex=True, sharey=True)
(ax0, ax1, ax2, ax3, ax4, ax5, ax6) = axs.values()
for ax in [ax0, ax1, ax2, ax3, ax4, ax5, ax6]:
    im_hsd = ax.matshow(hsd, cmap="gray", interpolation="none")

# DEM
im_dem = ax0.matshow(dem, cmap="terrain", alpha=0.7, interpolation="none")
ax0.set_title("DEM", fontsize='x-large')
fig.colorbar(im_dem, ax=ax0, orientation='vertical', shrink=0.75, pad=0.01, label='Elevation [m]')
# Slope
im_slope = ax1.matshow(slope, cmap="RdYlGn_r", alpha=0.7, interpolation="none")
ax1.set_title("Slope", fontsize='x-large')
fig.colorbar(im_slope, ax=ax1, orientation='vertical', shrink=0.75, pad=0.01, label='Slope [°]')
# Directions
im_dirflow = ax2.matshow(directions, cmap="twilight", alpha=0.7, interpolation="none")
ax2.set_title("Flow direction", fontsize='x-large')
fig.colorbar(im_dirflow, ax=ax2, orientation='vertical', shrink=0.75, pad=0.01, label='Flow dir index (ESRI notation)')
# Zmax
im_zmax = ax3.matshow(depth, cmap='viridis', alpha=0.7, interpolation="none")
ax3.set_title("$Z_\\mathrm{max}$", fontsize='x-large')
fig.colorbar(im_zmax, ax=ax3, orientation='vertical', shrink=0.75, pad=0.01, label='Depth [m]')
# Water table depth
im_depth = ax4.matshow(depth_w, cmap='Blues', alpha=0.7, interpolation="none")
ax4.set_title("Water table", fontsize='x-large')
fig.colorbar(im_depth, ax=ax4, orientation='vertical', shrink=0.75, pad=0.01, label='Depth [m]')
# Zones
im_zones = ax5.matshow(zones, cmap=plt.colormaps.get_cmap("Dark2").resampled(len(np.unique(zones))),
                       alpha=0.7, interpolation="none")
ax5.set_title("Zones", fontsize='x-large')
fig.colorbar(im_zones, ax=ax5, orientation='vertical', shrink=0.75, pad=0.01, label='Zones', ticks=np.unique(zones))
# Factor of safety
fs_output_file = f"{outputs_dir}/TRfs_min/TRfs_min_{proj_name}_{model}_1.asc"
fs, header = load_ascii_raster(fs_output_file)
im_fs = ax6.matshow(fs, cmap="RdYlGn", alpha=0.7, interpolation="none", vmin=1, vmax=2)
ax6.set_title("FS at $t=0$", fontsize='x-large')
fig.colorbar(im_fs, ax=ax6, orientation='vertical', shrink=0.75, pad=0.01, label='FS')

for ax in [ax0, ax1, ax2, ax3, ax4, ax5, ax6]:
    # if ax.get_subplotspec().is_last_col():
    if ax == ax6:
        ax.xaxis.set_ticks_position('bottom')
        ax.yaxis.set_ticks_position('left')
    else:
        ax.xaxis.set_ticks_position('none')

fig.canvas.header_visible = False
fig.canvas.toolbar_position = 'bottom'
plt.show()
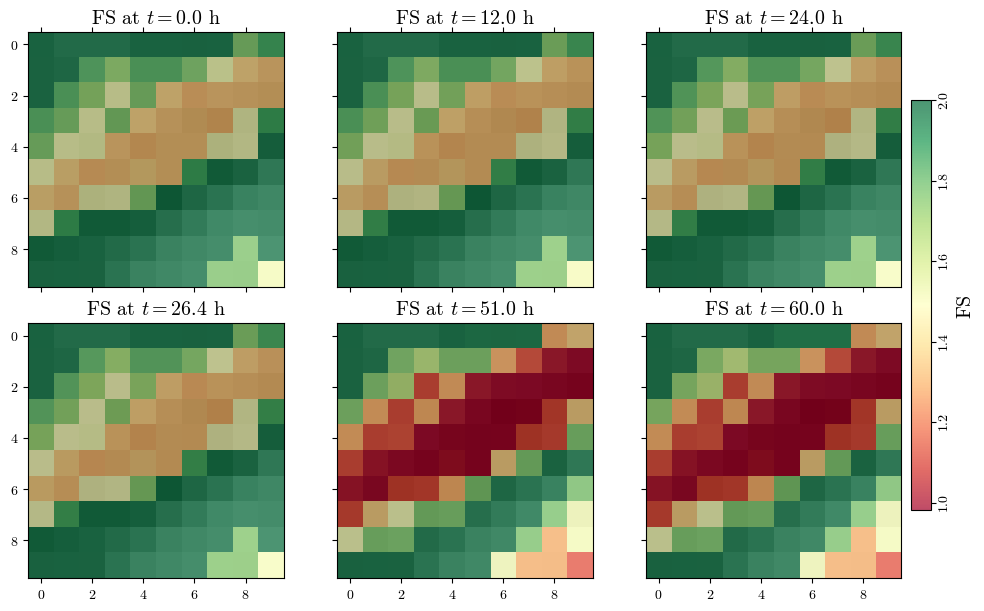
Visualizing spatial outputs of FS#
def read_time(file):
    with open(file, 'r') as file:
        lines = file.readlines()
        time = float(lines[4].split()[-1])
    return time

actual_output_times = []
for i in range(1, trg_inputs["n_outputs"]+1):
    time = read_time(f'{outputs_dir}/TR_ijz_p_th/TR_ijz_p_th_{proj_name}_{model}_{i}.txt')
    actual_output_times.append(time)

actual_output_times, list(output_times)
([0.0, 43200.0, 86400.0, 95040.0, 183600.0, 216000.0],
 [0.01, 43200.0, 86400.0, 100800.0, 183600.0, 216000.0])
n_subplots = len(actual_output_times)
nrows=np.ceil(n_subplots/3).astype(int)

fig, axs = plt.subplots(ncols=3, nrows=nrows, figsize=(10, 3*nrows), layout='constrained', sharex=True, sharey=True)
all_fs = []
for i, t in enumerate(actual_output_times):
    fs_output_file = f"{outputs_dir}/TRfs_min/TRfs_min_{proj_name}_{model}_{i+1}.asc"
    fs, header = load_ascii_raster(fs_output_file)
    all_fs.append(fs)
    ax = axs[i//3, i%3]
    im_hsd = ax.matshow(hsd, cmap="gray", interpolation="none")
    im_fs = ax.matshow(fs, cmap='RdYlGn', alpha=0.7)#, vmin=1.0, vmax=2, interpolation="none")

    ax.set_title(f"FS at $t={t/3600:.1f}$ h", fontsize='x-large')
    # ax.set_xticks([])
    # ax.set_yticks([])

min_fs, max_fs = np.nanmin(all_fs), np.nanmax(all_fs)  # change vmin and vmax to each subplot
max_fs = min(max_fs, 2)
for ax in axs.flatten():
    ax.images[1].set_clim(vmin=min_fs, vmax=max_fs)
    ax.xaxis.set_ticks_position('bottom') if ax.get_subplotspec().is_last_row() else None

cbar = fig.colorbar(im_fs, ax=axs, orientation='vertical', shrink=0.75, pad=0.01)
cbar.ax.tick_params(axis="y", labelrotation=90, pad=1.5)
cbar.set_label('FS', rotation=90, size="x-large")
[label.set_va("center") for label in cbar.ax.get_yticklabels()]
fig.canvas.header_visible = False
fig.canvas.toolbar_position = 'bottom'
plt.show()
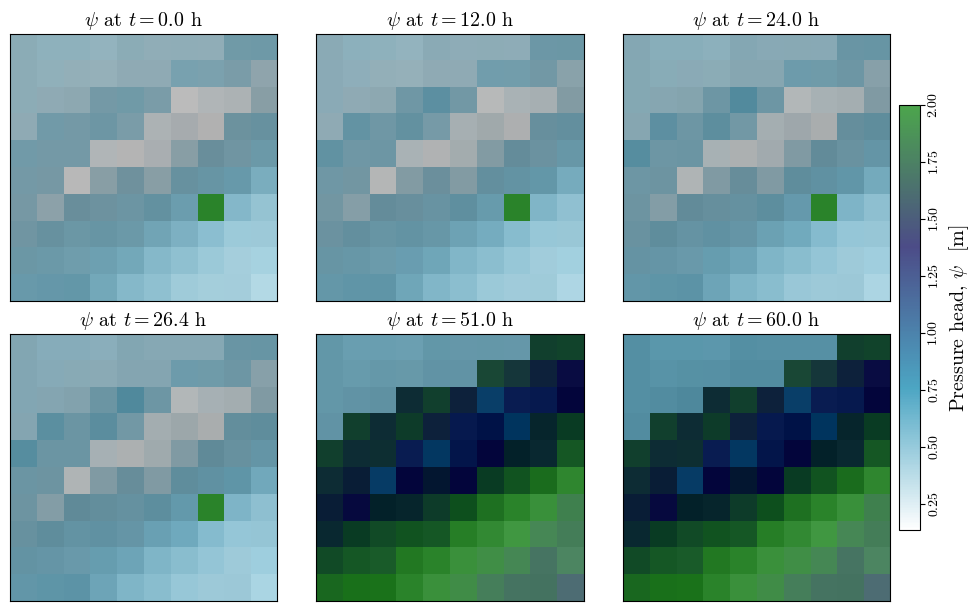
Visualizing spatial outputs of \(\psi\)#
n_subplots = len(actual_output_times)
nrows=np.ceil(n_subplots/3).astype(int)

fig, axs = plt.subplots(ncols=3, nrows=nrows, figsize=(10, 3*nrows), layout='constrained', sharex=True, sharey=True)
all_psi = []
for i, t in enumerate(actual_output_times):
    psi_output_file = f"{outputs_dir}/TRp_at_fs_min/TRp_at_fs_min_{proj_name}_{model}_{i+1}.asc"
    psi, header = load_ascii_raster(psi_output_file)
    all_psi.append(psi)
    ax = axs[i//3, i%3]
    im_hsd = ax.matshow(hsd, cmap="gray", interpolation="none")
    im_psi = ax.matshow(psi, cmap='ocean_r', alpha=0.7, interpolation="none")#, vmin=0, vmax=np.nanmax(depth))

    ax.set_title(f"$\psi$ at $t={t/3600:.1f}$ h", fontsize='x-large')
    ax.set_xticks([])
    ax.set_yticks([])

min_psi, max_psi = np.nanmin(all_psi), np.nanmax(all_psi)  # change vmin and vmax to each subplot
for ax in axs.flatten():
    ax.images[1].set_clim(vmin=min_psi, vmax=max_psi)
    ax.xaxis.set_ticks_position('bottom') if ax.get_subplotspec().is_last_row() else None

cbar = fig.colorbar(im_psi, ax=axs, orientation='vertical', shrink=0.75, pad=0.01)
cbar.ax.tick_params(axis="y", labelrotation=90, pad=1.5)
cbar.set_label('Pressure head, $\psi$  [m]', rotation=90, size="x-large")
[label.set_va("center") for label in cbar.ax.get_yticklabels()]
fig.canvas.header_visible = False
fig.canvas.toolbar_position = 'bottom'
plt.show()
Output to dataframe#
def get_param(zone, param):
    return trg_inputs['geoparams'][zone.iloc[0]][param]

def get_df(file):
    γ_w = 9.8e3  # [N/m3] unit weight of water
    # Reading file
    df = pd.read_csv(file, names=['i_tr', 'j_tr', 'elev', 'ψ', 'θ'], skiprows=7, sep='\s+')
    # Correcting indices to match numpy notation
    df['i'] = df['j_tr'].max() - df['j_tr']
    df['j'] = df['i_tr'] - 1
    df.drop(columns=['i_tr', 'j_tr'], inplace=True)
    # Calculating depths from elevations
    elev_max = df.groupby(['i', 'j'])['elev'].transform('max')
    df['z'] = elev_max - df['elev'] + 0.001
    df = df[['i', 'j', 'elev', 'z', 'ψ', 'θ']]
    # Assigning zones and geotechnical parameters
    df['zone'] = zones[df['i'], df['j']]
    for param_name in trg_inputs['geoparams'][1].keys():
        df[param_name] = df.groupby('zone')['zone'].transform(get_param, param=param_name)
    # Correting rows with ψ==0 (watertable) due to numerical errors
    mask = (df['ψ'] == 0) & (df['z'] > 0.001) & (df['θ'] == df['θ_sat'])
    # df.loc[mask, 'z'] = df.loc[mask, 'z'] + 1/df.loc[mask, 'α']
    # df.loc[mask, 'elev'] = df.loc[mask, 'elev'] - 1/df.loc[mask, 'α']
    # df.sort_values(['i', 'j', 'z'], inplace=True)
    df.drop(df[mask].index, inplace=True)  # This eliminates the wt rows
    # Assigning slope
    df['δ'] = slope[df['i'], df['j']]
    δrad = np.deg2rad(df['δ'])
    # Calculating effective stress parameter, χ
    df['χ'] = (df['θ'] - df['θ_res']) / (df['θ_sat'] - df['θ_res'])
    # Specific gravity
    df['Gs'] = (df['γ_sat']/γ_w - df['θ_sat']) / (1 - df['θ_sat'])
    # unit weight at unsat and sat zones
    df['γ_nat'] = (df['Gs'] * (1 - df['θ_sat']) + df['θ']) * γ_w
    # average unit weight
    γ_cumul = df.groupby(['i', 'j'])['γ_nat'].transform('cumsum')
    idx = df.groupby(['i', 'j'])['γ_nat'].cumcount() + 1
    df['γ_avg'] = γ_cumul / idx
    # Factor of safety
    fs1 = np.tan(np.deg2rad(df['φ'])) / np.tan(δrad)
    fs2_num = df['c'] - df['ψ'] * γ_w * df['χ'] * np.tan(np.deg2rad(df['φ']))
    fs2_den = df['γ_avg'] * df['z'] * np.sin(δrad) * np.cos(δrad)
    fs = fs1 + fs2_num/fs2_den
    fs[fs > 3] = 3
    df['fs'] = fs
    return df
Verification of FS and head pressure at a point#
cell = (2, 2)  # (i, j) indices of the unique cell in the domain (i=y, j=x) in numpy notation

file = f'{outputs_dir}/TR_ijz_p_th/TR_ijz_p_th_{proj_name}_{model}_4.txt'
df = get_df(file)
cell_df = df[(df['i']==cell[0]) & (df['j']==cell[1])]
# cell_df.drop(cell.index[cell['ψ'] == 0], inplace=True)
cell_df.head()
| i | j | elev | z | ψ | θ | zone | c | φ | γ_sat | ... | K_sat | θ_sat | θ_res | α | δ | χ | Gs | γ_nat | γ_avg | fs | |
|---|---|---|---|---|---|---|---|---|---|---|---|---|---|---|---|---|---|---|---|---|---|
| 484 | 2 | 2 | 96.0 | 0.001 | -0.04532 | 0.45 | 1.0 | 3500.0 | 35 | 22000.0 | ... | 1.000000e-07 | 0.45 | 0.05 | -0.5 | 23.0 | 1.0 | 3.263451 | 22000.0 | 22000.0 | 3.0 |
| 485 | 2 | 2 | 95.9 | 0.101 | -0.07715 | 0.45 | 1.0 | 3500.0 | 35 | 22000.0 | ... | 1.000000e-07 | 0.45 | 0.05 | -0.5 | 23.0 | 1.0 | 3.263451 | 22000.0 | 22000.0 | 3.0 |
| 486 | 2 | 2 | 95.8 | 0.201 | -0.10210 | 0.45 | 1.0 | 3500.0 | 35 | 22000.0 | ... | 1.000000e-07 | 0.45 | 0.05 | -0.5 | 23.0 | 1.0 | 3.263451 | 22000.0 | 22000.0 | 3.0 |
| 487 | 2 | 2 | 95.7 | 0.301 | -0.12030 | 0.45 | 1.0 | 3500.0 | 35 | 22000.0 | ... | 1.000000e-07 | 0.45 | 0.05 | -0.5 | 23.0 | 1.0 | 3.263451 | 22000.0 | 22000.0 | 3.0 |
| 488 | 2 | 2 | 95.6 | 0.401 | -0.13190 | 0.45 | 1.0 | 3500.0 | 35 | 22000.0 | ... | 1.000000e-07 | 0.45 | 0.05 | -0.5 | 23.0 | 1.0 | 3.263451 | 22000.0 | 22000.0 | 3.0 |
5 rows × 21 columns
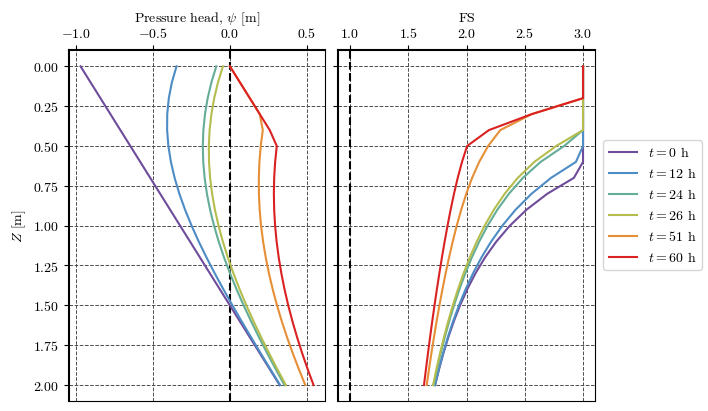
Plotting results at a point#
clrs = ['#6F4C9B', '#6059A9', '#5568B8', '#4E79C5', '#4D8AC6', '#4E96BC',
        '#549EB3', '#59A5A9', '#60AB9E', '#69B190', '#77B77D', '#8CBC68',
        '#A6BE54', '#BEBC48', '#D1B541', '#DDAA3C', '#E49C39', '#E78C35',
        '#E67932', '#E4632D', '#DF4828', '#DA2222']
cmap = mpl.colors.LinearSegmentedColormap.from_list('cmap_name', clrs)
# cmap
fig, axs = plt.subplots(nrows=1, ncols=2, figsize=(7, 4), sharey=True, layout='constrained')

palette = mpl.colormaps['gnuplot_r']
palette = cmap
for ax in axs:
    ax.grid(True, color='0.3', ls='--', lw=0.7)
    ax.spines["top"].set_linewidth(1.5)
    ax.spines["left"].set_linewidth(1.5)
    ax.xaxis.set_ticks_position('top')
    ax.xaxis.set_tick_params(top=True, bottom=False)
    ax.xaxis.set_label_position('top')
    ax.set_prop_cycle('color', palette(np.linspace(0, 1, len(output_times))))

axs[0].axvline(0, color='k', lw=1.5, ls='--')
axs[1].axvline(1, color='k', lw=1.5, ls='--')

for n in np.arange(len(output_times)) + 1:
    file = f'TRIGRS_2/outputs/TR_ijz_p_th/TR_ijz_p_th_{proj_name}_{model}_{n}.txt'
    t = read_time(file)
    df = get_df(file)
    df_cell = df[(df['i']==cell[0]) & (df['j']==cell[1])]
    axs[0].plot(df_cell['ψ'], df_cell['z'], label=f'$t={t/3600:.0f}$ h')
    axs[1].plot(df_cell['fs'], df_cell['z'], label=f'$t={t/3600:.0f}$ h')
    axs[0].set(xlabel='Pressure head, $\\psi$ [m]', ylabel='$Z$ [m]')
    axs[1].set(xlabel='FS')

axs[1].invert_yaxis()
handles, labels = axs[0].get_legend_handles_labels()
fig.legend(handles, labels, loc='outside right center')
fig.canvas.header_visible = False
fig.canvas.toolbar_position = 'bottom'
plt.show()