© 2024 Daniel F. Ruiz, Exneyder A. Montoya-Araque y Universidad EAFIT.
This notebook can be interactively run in Google - Colab.
This notebook runs the model TRIGRS (Transient Rainfall Infiltration and Grid-Based Regional Slope-Stability Analysis), developed by Baum et al. (2002) and Baum et al. (2008), and parallelized later by Alvioli & Baum (2016)
Required modules and global setup for plots
import os
import subprocess
import textwrap
import itertools
import shutil
import math

import numpy as np
import pandas as pd
import matplotlib.pyplot as plt
import matplotlib as mpl
from IPython import get_ipython
import rasterio
from rasterio.enums import Resampling
from rasterio.warp import reproject
from affine import Affine

if 'google.colab' in str(get_ipython()):
    print('Running on CoLab. Installing the required modules...')
    # subprocess.run('pip install ipympl', shell=True);
    # subprocess.run('pip install palettable', shell=True);
    subprocess.run('pip install pynewmarkdisp', shell=True);
    subprocess.run('pip install pysheds', shell=True);
    from google.colab import output, files
    output.enable_custom_widget_manager()

else:
    import tkinter as tk
    from tkinter.filedialog import askopenfilename

from pynewmarkdisp.spatial import get_hillshade
from pysheds.grid import Grid

# Figures setup
# %matplotlib widget
%matplotlib inline

mpl.rcParams.update({
    "font.family": "serif",
    "font.serif": ["Computer Modern Roman", "cmr", "cmr10", "DejaVu Serif"],  # or
    "mathtext.fontset": "cm",  # Use Computer Modern fonts for math
    "axes.formatter.use_mathtext": True,  # Use mathtext for axis labels
    "axes.unicode_minus": False,   # Use standard minus sign instead of a unicode character
})

def load_ascii_raster(path, dtype=None):
    raster = np.loadtxt(path, skiprows=6)
    header = np.loadtxt(path, max_rows=6, dtype=object)
    header = {
        "ncols": int(header[0, 1]),
        "nrows": int(header[1, 1]),
        "xllcorner": float(header[2, 1]),
        "yllcorner": float(header[3, 1]),
        "cellsize": float(header[4, 1]),
        "nodata_value": eval(header[5, 1]),
    }
    raster[np.where(raster == header["nodata_value"])] = np.nan
    raster = raster.astype(dtype) if dtype is not None else raster
    return (raster, header)


def get_asc_from_url(file_name):
    base_url = "https://raw.githubusercontent.com/eamontoyaa/data4testing/main/trigrs/tutorial_data"
    url = f"{base_url}/{file_name}.asc"
    output_path = os.path.join(inputs_dir, f"{file_name}.asc")

    # if os.path.exists(output_path):
    #     print(f"🟡 {file_name}.asc already exists at {output_path} — skipping download.")
    #     return

    try:
        subprocess.run(["wget", "-q", "-O", output_path, url], check=True)
        print(f"✅ {file_name}.asc downloaded successfully.")
    except subprocess.CalledProcessError:
        print(f"❌ Failed to download {file_name}.asc from {url}")

def load_raster(file_path, masked=True):
    """
    Load a raster file (e.g., DEM or other geospatial raster) and extract its key metadata.

    Parameters:
        file_path (str): Path to the raster file (e.g., a GeoTIFF).

    Returns:
        tuple:
            - data (np.ndarray): 2D array of raster values (first band).
            - transform (Affine): Affine transformation mapping pixel coordinates to spatial coordinates.
            - bounds (BoundingBox): Bounding box of the raster in spatial coordinates.
            - crs (CRS): Coordinate Reference System of the raster.
            - nodata (float or int or None): Value used to represent no-data pixels, if defined.
    """
    with rasterio.open(file_path) as src:
        data = src.read(1, masked=masked)  # Read the first band, optionally masked
        transform = src.transform
        bounds = src.bounds
        crs = src.crs
        nodata = src.nodata
        # affine = src.affine
    return data, transform, bounds, crs, nodata

def save_raster(file_path, array, crs, transform, nodata=None, format="tif"):
    if format == "asc":
        print("Writing ASCII file...")
        _save_asc(file_path, array, transform, nodata)
    else:
        print("Writing GeoTIFF file...")
        driver = "GTiff"
        with rasterio.open(
            file_path, "w", driver=driver,
            height=array.shape[0], width=array.shape[1],
            count=1, dtype=array.dtype,
            crs=crs, transform=transform, nodata=nodata,
        ) as dst:
            dst.write(array, 1)

def _save_asc(file_path, array, transform, nodata):
    nrows, ncols = array.shape
    xll = transform.c
    yll = transform.f - nrows * transform.e  # transform.e es negativo
    cellsize = transform.a

    with open(file_path, "w") as f:
        f.write(f"ncols        {ncols}\n")
        f.write(f"nrows        {nrows}\n")
        f.write(f"xllcorner    {xll:.12f}\n")
        f.write(f"yllcorner    {yll:.12f}\n")
        f.write(f"cellsize     {cellsize:.12f}\n")
        if nodata is not None:
            f.write(f"NODATA_value {nodata}\n")

        # Escribe con formato consistente: 4 decimales para floats
        fmt = "%.4f" if np.issubdtype(array.dtype, np.floating) else "%d"
        np.savetxt(f, array, fmt=fmt)

def build_target_grid(transform, width, height, target_cellsize):
    """
    Construye una nueva grilla con celda más grande, conservando la misma extensión.
    """
    x_min = transform.c
    y_max = transform.f

    x_max = x_min + width * transform.a
    y_min = y_max + height * transform.e  # e normalmente es negativo

    new_width = math.ceil((x_max - x_min) / target_cellsize)
    new_height = math.ceil((y_max - y_min) / target_cellsize)

    new_transform = Affine(
        target_cellsize, 0.0, x_min,
        0.0, -target_cellsize, y_max
    )

    return new_transform, new_width, new_height


def resample_masked_raster(
    raster,
    src_transform,
    src_crs,
    dst_transform,
    dst_width,
    dst_height,
    is_categorical=False,
    src_nodata=None,
):
    """
    Remuestrea un raster enmascarado (`np.ma.MaskedArray`) a una grilla destino.
    """
    if src_nodata is None:
        src_nodata = -9999

    if is_categorical:
        dst_dtype = np.int32
        dst_nodata = -9999
        resampling_method = Resampling.nearest
    else:
        dst_dtype = np.float32
        dst_nodata = -9999.0
        # Para variables continuas al pasar a celda más grande,
        # average suele ser mejor que nearest.
        resampling_method = Resampling.average

    src_data = raster.filled(src_nodata).astype(dst_dtype)

    dst_data = np.full((dst_height, dst_width), dst_nodata, dtype=dst_dtype)

    reproject(
        source=src_data,
        destination=dst_data,
        src_transform=src_transform,
        src_crs=src_crs,
        src_nodata=src_nodata,
        dst_transform=dst_transform,
        dst_crs=src_crs,
        dst_nodata=dst_nodata,
        resampling=resampling_method,
    )

    dst_mask = (dst_data == dst_nodata)
    dst_raster = np.ma.masked_array(dst_data, mask=dst_mask)

    return dst_raster, dst_nodata
Creating directories
project_name = "ET260320"

# Create a folder called TRIGRS in the current working directory if it doesn't exist
workdir = os.getcwd()
exec_dir = os.path.join(workdir, project_name)
os.makedirs(f"{exec_dir}", exist_ok=True)

# Create a folder inside TRIGRS to store the ascii files
inputs_dir = os.path.join(exec_dir, "inputs")
outputs_dir = os.path.join(exec_dir, "outputs")
os.makedirs(f"{inputs_dir}", exist_ok=True)
os.makedirs(f"{outputs_dir}", exist_ok=True)
Loading spatial files and creating .asc files
def upload_raster_to_colab(file_name):
    uploaded = files.upload()  # sube el archivo
    for filename in uploaded.keys():
        shutil.move(filename, os.path.join(inputs_dir, f"{file_name}.tif"))
testing_data = True
resample_data = False
target_cellsize = 50
if testing_data is False:
print("Uploading DEM file...")
upload_raster_to_colab("dem")
# uploaded = files.upload() # sube el archivo
# for filename in uploaded.keys():
# shutil.move(filename, os.path.join(inputs_dir, f"dem.tif"))
print("Procesing DEM to obtain the flow direction raster...")
# Read raw DEM
dem, transform_dem, bounds_dem, crs_dem, nodata_dem = load_raster(os.path.join(inputs_dir, f"dem.tif"), masked=True)
cellsize = transform_dem.a
# Create grid structure
grid = Grid.from_raster(os.path.join(inputs_dir, f"dem.tif"))
dem = grid.read_raster(os.path.join(inputs_dir, f"dem.tif"))
# Fill depressions
flooded_dem = grid.fill_depressions(dem)
# Resolve flats
inflated_dem = grid.resolve_flats(flooded_dem)
# Specify directional mapping
#N NE E SE S SW W NW
dirmap = (64, 128, 1, 2, 4, 8, 16, 32) # ESRI flow direction scheme
dirmap = (2, 3, 6, 9, 8, 7, 4, 1) # TopoIndex flow direction scheme
# Compute flow directions
# -------------------------------------
fdir = grid.flowdir(inflated_dem, dirmap=dirmap)
fdir[fdir <= 0] = -9999
fdir[dem==nodata_dem] = -9999
# Save flow directions as ASCII file
save_raster(f"{inputs_dir}/directions.tif", fdir, crs=crs_dem, transform=transform_dem, nodata=-9999, format="tif")
print("Flow direction raster created.")if testing_data:
for file in ['dem', 'zmax', 'depthwt', 'slope', 'directions', 'rizero', 'zones']:
get_asc_from_url(file)
dem, header = load_ascii_raster(f"{inputs_dir}/dem.asc")
cellsize = header['cellsize']
slope, header = load_ascii_raster(f"{inputs_dir}/slope.asc")
directions, header = load_ascii_raster(f"{inputs_dir}/directions.asc")
zones, header = load_ascii_raster(f"{inputs_dir}/zones.asc")
depth, header = load_ascii_raster(f"{inputs_dir}/zmax.asc")
rizero, header = load_ascii_raster(f"{inputs_dir}/rizero.asc")
depth_w, header = load_ascii_raster(f"{inputs_dir}/depthwt.asc")
if not testing_data:
dem, transform_dem, bounds_dem, crs_dem, nodata_dem = load_raster(os.path.join(inputs_dir, f"dem.tif"), masked=True)
directions, transform_directions, bounds_directions, crs_directions, nodata_directions = load_raster(os.path.join(inputs_dir, "directions.tif"), masked=True)
print("Uploading the slope raster...")
upload_raster_to_colab("slope")
slope, transform_slope, bounds_slope, crs_slope, nodata_slope = load_raster(os.path.join(inputs_dir, "slope.tif"), masked=True)
print("Uploading the zones raster...")
upload_raster_to_colab("zones")
zones, transform_zones, bounds_zones, crs_zones, nodata_zones = load_raster(os.path.join(inputs_dir, "zones.tif"), masked=True)
print("Uploading the Zmax raster...")
upload_raster_to_colab("zmax")
depth, transform_depth, bounds_depth, crs_depth, nodata_depth = load_raster(os.path.join(inputs_dir, "zmax.tif"), masked=True)
print("Uploading the Zw raster...")
upload_raster_to_colab("depthwt")
depth_w, transform_depth_w, bounds_depth_w, crs_depth_w, nodata_depth_w = load_raster(os.path.join(inputs_dir, "depthwt.tif"), masked=True)
✅ dem.asc downloaded successfully.
✅ zmax.asc downloaded successfully.
✅ depthwt.asc downloaded successfully.
✅ slope.asc downloaded successfully.
✅ directions.asc downloaded successfully.
✅ rizero.asc downloaded successfully.
✅ zones.asc downloaded successfully.
if not testing_data and resample_data:
    print("Creating the ASC files (resampling spatial resolution)...")

    src_height, src_width = dem.shape
    target_transform, target_width, target_height = build_target_grid(
        transform_dem, src_width, src_height, target_cellsize
    )

    print(f"Original DEM shape: {dem.shape}")
    print(f"Target shape: {(target_height, target_width)}")
    print(f"Target cellsize: {target_cellsize}")

    print("Resampling rasters to coarser grid...")
    dem_rs, nodata_dem_rs = resample_masked_raster(
        dem, transform_dem, crs_dem,
        target_transform, target_width, target_height,
        is_categorical=False, src_nodata=nodata_dem
    )

    slope_rs, nodata_slope_rs = resample_masked_raster(
        slope, transform_slope, crs_slope,
        target_transform, target_width, target_height,
        is_categorical=False, src_nodata=nodata_slope
    )

    directions_rs, nodata_directions_rs = resample_masked_raster(
        directions, transform_directions, crs_directions,
        target_transform, target_width, target_height,
        is_categorical=True, src_nodata=nodata_directions
    )

    zones_rs, nodata_zones_rs = resample_masked_raster(
        zones, transform_zones, crs_zones,
        target_transform, target_width, target_height,
        is_categorical=True, src_nodata=nodata_zones
    )

    depth_rs, nodata_depth_rs = resample_masked_raster(
        depth, transform_depth, crs_depth,
        target_transform, target_width, target_height,
        is_categorical=False, src_nodata=nodata_depth
    )

    depth_w_rs, nodata_depth_w_rs = resample_masked_raster(
        depth_w, transform_depth_w, crs_depth_w,
        target_transform, target_width, target_height,
        is_categorical=False, src_nodata=nodata_depth_w
    )

    print("Creating nodata mask from resampled rasters...")
    nodata_mask_rs = (
        dem_rs.mask
        | slope_rs.mask
        | directions_rs.mask
        | zones_rs.mask
        | depth_rs.mask
        | depth_w_rs.mask
    )

    print("Saving ASC files...")
    rasters_to_save = [
        (dem_rs, "dem", False),
        (slope_rs, "slope", False),
        (directions_rs, "directions", True),
        (zones_rs, "zones", True),
        (depth_rs, "zmax", False),
        (depth_w_rs, "depthwt", False),
    ]

    for raster, file_name, is_categorical in rasters_to_save:
        if is_categorical:
            raster_out = raster.astype(np.int32)
            nodata = -9999
        else:
            raster_out = raster.astype(np.float32)
            nodata = -9999.0

        raster_out[nodata_mask_rs] = nodata

        print(
            f"Processing {file_name}, "
            f"type: {raster_out.dtype}, "
            f"shape: {raster_out.shape}, "
            f"n_nodata: {np.count_nonzero(raster_out.data == nodata)}"
        )

        save_raster(
            f"{inputs_dir}/{file_name}.asc",
            raster_out,
            crs_dem,
            target_transform,
            nodata=nodata,
            format="asc",
        )
elif not testing_data and not resample_data:
    print("Creating the ASC files (original spatial resolution)...")
    nodata_mask = dem.mask | slope.mask | directions.mask | zones.mask | depth.mask | depth_w.mask

    # Convert rasters to the appropriate data types and apply nodata mask
    for raster, file_name in zip([dem, slope, directions, zones, depth, depth_w], ['dem', 'slope', 'directions', 'zones', 'zmax', 'depthwt']):
        if file_name in ['zones', 'directions']:
            raster = raster.astype(int)
            nodata = -9999
        else:  # raster to float32
            raster = raster.astype(float)
            nodata = -9999.0
        # apply nodata mask
        raster[nodata_mask] = nodata
        print(f"Procesing {file_name}, type: {raster.dtype}, shape: {raster.shape}, n_nodata: {np.count_nonzero(raster.data == nodata)}")
        # save raster
        save_raster(f"{inputs_dir}/{file_name}.asc", raster, crs_dem, transform_dem, nodata=nodata, format="asc")
Visualizing spatial inputs (conditioning factors)
hsd = get_hillshade(dem, sun_azimuth=000, sun_altitude=30, cellsize=cellsize)

fig, axs = plt.subplots(nrows=2, ncols=3, layout='constrained', figsize=(10, 7), sharex=True, sharey=True)
(ax0, ax1, ax2, ax3, ax4, ax5) = axs.flatten()

for ax in [ax0, ax1, ax2, ax3, ax4, ax5]:
    im_hsd = ax.matshow(hsd, cmap="gray", interpolation="none")

# DEM
im_dem = ax0.matshow(dem, cmap="terrain", alpha=0.7, interpolation="none")
ax0.set_title("DEM", fontsize='x-large')
fig.colorbar(im_dem, ax=ax0, orientation='vertical', shrink=0.75, pad=0.01, label='Elevation [m]')
# Slope
im_slope = ax1.matshow(slope, cmap="RdYlGn_r", alpha=0.7, interpolation="none")
ax1.set_title("Slope", fontsize='x-large')
fig.colorbar(im_slope, ax=ax1, orientation='vertical', shrink=0.75, pad=0.01, label='Slope [°]')
# Directions
im_dirflow = ax2.matshow(directions, cmap="twilight", alpha=0.7, interpolation="none")
ax2.set_title("Flow direction", fontsize='x-large')
fig.colorbar(im_dirflow, ax=ax2, orientation='vertical', shrink=0.75, pad=0.01, label='Flow dir index (TopoIndex notation)')
# Zmax
im_zmax = ax3.matshow(depth, cmap='viridis', alpha=0.7, interpolation="none")
ax3.set_title("$Z_\\mathrm{max}$", fontsize='x-large')
fig.colorbar(im_zmax, ax=ax3, orientation='vertical', shrink=0.75, pad=0.01, label='Depth [m]')
# Water table depth
im_depth = ax4.matshow(depth_w, cmap='Blues', alpha=0.7, interpolation="none")
ax4.set_title("Water table", fontsize='x-large')
fig.colorbar(im_depth, ax=ax4, orientation='vertical', shrink=0.75, pad=0.01, label='Depth [m]')
# Zones
im_zones = ax5.matshow(zones, cmap=plt.colormaps.get_cmap("Dark2").resampled(len(np.unique(zones))),
                       alpha=0.7, interpolation="none")
ax5.set_title("Zones", fontsize='x-large')
fig.colorbar(im_zones, ax=ax5, orientation='vertical', shrink=0.75, pad=0.01, label='Zones', ticks=np.unique(zones))


for ax in [ax0, ax3]:
    ax.yaxis.set_ticks_position('left')
for ax in [ax3, ax4, ax5]:
    ax.xaxis.set_ticks_position('bottom')

fig.canvas.header_visible = False
fig.canvas.toolbar_position = 'bottom'
plt.show()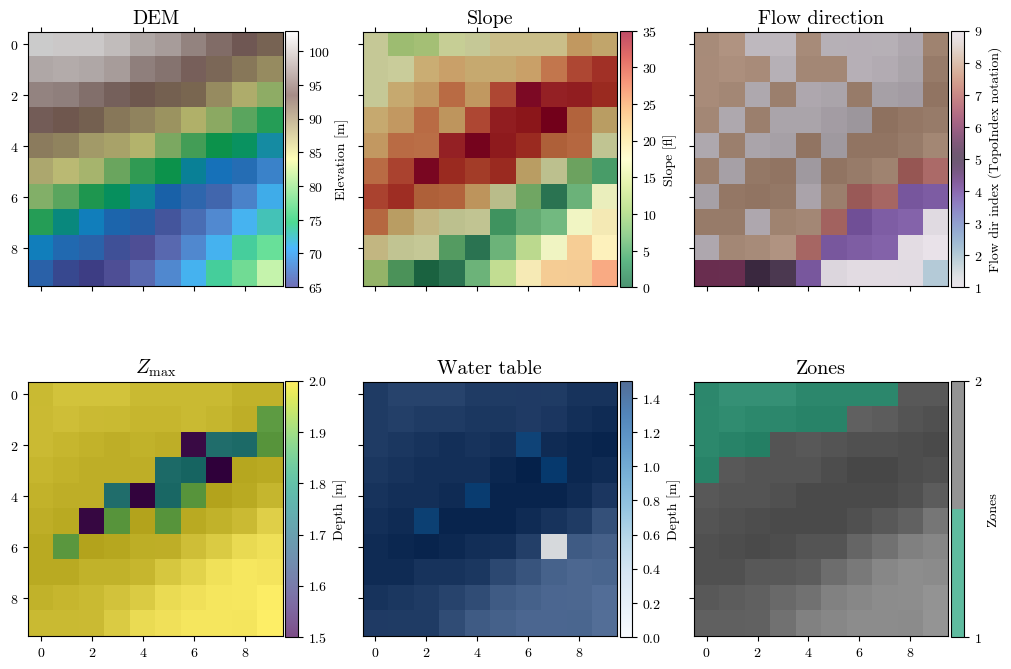
if not testing_data and resample_data:
    # n zones as non nan unique values in zones raster
    n_zones = len(np.unique(zones_rs[~nodata_mask_rs]))
    print(f"Number of zones: {n_zones}")
    print(f"Unique zones: {np.unique(zones_rs[~nodata_mask_rs])}")
elif not testing_data and not resample_data:
    # n zones as non nan unique values in zones raster
    n_zones = len(np.unique(zones[~nodata_mask]))
    print(f"Number of zones: {n_zones}")
    print(f"Unique zones: {np.unique(zones[~nodata_mask])}")
else:
    n_zones = 2
Functions
def tpx_in_maker(tpx_inputs):
    tpx_in_template = textwrap.dedent(
        f"""\
        TopoIndex 1.0.15; Name of project (up to 255 characters)
        TopoIndex analysis - Project: {tpx_inputs["proj_name"]}
        Flow-direction numbering scheme (ESRI=1, TopoIndex=2)
        {tpx_inputs["flow_dir_scheme"]}
        Exponent, Number of iterations
        {tpx_inputs["exponent_weight_fact"]}, {tpx_inputs["iterarions"]}
        Name of elevation grid file
        {project_name}/inputs/dem.asc
        Name of direction grid
        {project_name}/inputs/directions.asc
        Save listing of D8 downslope neighbor cells (TIdsneiList_XYZ)?  Enter T (.true.) or F (.false.)
        T
        Save grid of D8 downslope neighbor cells (***TIdscelGrid_XYZ)? Enter T (.true.) or F (.false.)
        T
        Save cell index number grid (TIcelindxGrid_XYZ)?  Enter T (.true.) or F (.false.)
        T
        Save list of cell number and corresponding index number (***TIcelindxList_XYZ)? Enter T (.true.) or F (.false.)
        T
        Save flow-direction grid remapped from ESRI to TopoIndex (TIflodirGrid_XYZ)? Enter T (.true.) or F (.false.)
        T
        Save grid of points on ridge crests (TIdsneiList_XYZ)? Enter T (.true.) or F (.false.); Sparse (T) or dense (F)?
        F,T
        ID code for output files? (8 characters or less)
        {tpx_inputs["proj_name"]}"""
    )
    with open("tpx_in.txt", "w") as file:
        file.write(tpx_in_template)
    return


def run_topoidx(tpx_inputs):
    tpx_in_maker(tpx_inputs)  # Generating initializing files
    _ = subprocess.run([f"chmod +x ./{project_name}/Exe_TopoIndex"], shell=True, capture_output=True, text=True)
    # out = subprocess.run([f"./{project_name}/Exe_TopoIndex"], shell=True, capture_output=True, text=True)

    with subprocess.Popen(
        [f"./{project_name}/Exe_TopoIndex"],
        stdout=subprocess.PIPE,
        stderr=subprocess.STDOUT,
        text=True
    ) as proceso:
        for linea in proceso.stdout:
            print(linea, end="")

    # subprocess.call([f"chmod +x ./{project_name}/Exe_TopoIndex"], shell=True)  # Change permission
    # subprocess.call([f"./{project_name}/Exe_TopoIndex"])  # Running Fortran executable
    # Moving log file to outputs folder and renaming it
    os.rename(os.path.join(workdir, "TopoIndexLog.txt"), os.path.join(outputs_dir, f"TopoIndexLog_{tpx_inputs['proj_name']}.txt"))
    os.rename(os.path.join(workdir, "tpx_in.txt"), os.path.join(exec_dir, f"tpx_in_{tpx_inputs['proj_name']}.txt"))
    return


def tr_in_maker(trg_inputs):
    # Create text block for geotechnical parameters of each zone
    geoparams = ""
    for zone in trg_inputs["geoparams"].keys():
        z = trg_inputs["geoparams"][zone]
        txt_zone = "".join(
            [
                f"zone, {zone}\n",
                "cohesion, phi, uws, diffus, K-sat, Theta-sat, Theta-res, Alpha\n",
                f'{z["c"]}, {z["φ"]}, {z["γ_sat"]}, {z["D_sat"]}, {z["K_sat"]}, {z["θ_sat"]}, {z["θ_res"]}, {z["α"]}\n',
            ]
        )
        # print(txt_zone)
        geoparams = str().join([geoparams, txt_zone])
    # Update rifil entry with placeholder for each file
    trg_inputs["rifil"] = str().join(
        [f"{project_name}/inputs/ri{n}.asc\n" for n in range(1, len(trg_inputs["capt"]))]
    )

    # Template
    trg_in_template = (
        textwrap.dedent(
            f"""\
        Project: {trg_inputs['proj_name']}
        TRIGRS, version 2.1.00c, (meter-kilogram-second-degrees units)
        tx, nmax, mmax, zones
        {trg_inputs['tx']}, {trg_inputs['nmax']}, {trg_inputs['mmax']}, {trg_inputs['zones']}
        nzs, zmin, uww, nper t
        {trg_inputs['nzs']}, 0.001, 9.8e3, {trg_inputs['nper']}, {trg_inputs['t']}
        zmax, depth, rizero, Min_Slope_Angle (degrees), Max_Slope_Angle (degrees)
        {trg_inputs['zmax']}, {trg_inputs['depth']}, {trg_inputs['rizero']}, 0., 90.0
        """
        )
        + geoparams[:-1]
        + textwrap.dedent(
            f"""
        cri(1), cri(2), ..., cri(nper)
        {', '.join(map(str, trg_inputs['cri']))}
        capt(1), capt(2), ..., capt(n), capt(n+1)
        {', '.join(map(str, trg_inputs['capt']))}
        File name of slope angle grid (slofil)
        {project_name}/inputs/slope.asc
        File name of digital elevation grid (elevfil)
        {project_name}/inputs/dem.asc
        File name of property zone grid (zonfil)
        {project_name}/inputs/zones.asc
        File name of depth grid (zfil)
        {project_name}/inputs/zmax.asc
        File name of initial depth of water table grid   (depfil)
        {project_name}/inputs/depthwt.asc
        File name of initial infiltration rate grid   (rizerofil)
        {project_name}/inputs/rizero.asc
        List of file name(s) of rainfall intensity for each period, (rifil())
        """
        )
        + trg_inputs["rifil"][:-2]
        + textwrap.dedent(
            f"""
        File name of grid of D8 runoff receptor cell numbers (nxtfil)
        {project_name}/inputs/TIdscelGrid_{trg_inputs['proj_name']}.txt
        File name of list of defining runoff computation order (ndxfil)
        {project_name}/inputs/TIcelindxList_{trg_inputs['proj_name']}.txt
        File name of list of all runoff receptor cells  (dscfil)
        {project_name}/inputs/TIdscelList_{trg_inputs['proj_name']}.txt
        File name of list of runoff weighting factors  (wffil)
        {project_name}/inputs/TIwfactorList_{trg_inputs['proj_name']}.txt
        Folder where output grid files will be stored  (folder)
        {project_name}/outputs/
        Identification code to be added to names of output files (suffix)
        {trg_inputs['proj_name']}
        Save grid files of runoff? Enter T (.true.) or F (.false.)
        F
        Save grid of minimum factor of safety? Enter T (.true.) or F (.false.)
        T
        Save grid of depth of minimum factor of safety? Enter T (.true.) or F (.false.)
        T
        Save grid of pressure head at depth of minimum factor of safety? Enter T (.true.) or F (.false.)
        T
        Save grid of computed water table depth or elevation? Enter T (.true.) or F (.false.) followed by 'depth,' or 'eleva'
        T, depth
        Save grid files of actual infiltration rate? Enter T (.true.) or F (.false.)
        F
        Save grid files of unsaturated zone basal flux? Enter T (.true.) or F (.false.)
        F
        Save listing of pressure head and factor of safety ("flag")? (-9 sparse xmdv , -8 down-sampled xmdv, -7 full xmdv, -6 sparse ijz, -5 down-sampled ijz, -4 full ijz, -3 Z-P-Fs-saturation list -2 detailed Z-P-Fs, -1 Z-P-Fs list, 0 none). Enter flag value followed by down-sampling interval (integer).
        {trg_inputs['ψ_flag']}, {trg_inputs['nzs']}
        Number of times to save output grids and (or) ijz/xmdv files
        {trg_inputs['n_outputs']}
        Times of output grids and (or) ijz/xmdv files
        {', '.join(map(str, trg_inputs['t_n_outputs']))}
        Skip other timesteps? Enter T (.true.) or F (.false.)
        F
        Use analytic solution for fillable porosity?  Enter T (.true.) or F (.false.)
        T
        Estimate positive pressure head in rising water table zone (i.e. in lower part of unsat zone)?  Enter T (.true.) or F (.false.)
        T
        Use psi0=-1/alpha? Enter T (.true.) or F (.false.) (False selects the default value, psi0=0)
        F
        Log mass balance results?   Enter T (.true.) or F (.false.)
        T
        Flow direction (Enter "gener", "slope", or "hydro")
        {trg_inputs['flowdir']}
        Add steady background flux to transient infiltration rate to prevent drying beyond the initial conditions during periods of zero infiltration?
        T
        Specify file extension for output grids. Enter T (.true.) for ".asc" or F for ".txt"
        T
        Ignore negative pressure head in computing factor of safety (saturated infiltration only)?   Enter T (.true.) or F (.false.)
        T
        Ignore height of capillary fringe in computing pressure head for unsaturated infiltration option?   Enter T (.true.) or F (.false.)
        T
        Parameters for deep pore-pressure estimate in SCOOPS ijz output: Depth below ground surface (positive, use negative value to cancel this option), pressure option (enter 'zero' , 'flow' , 'hydr' , or 'relh')
        -50.0,flow
        """
        )
    )
    # Create txt file
    with open("tr_in.txt", "w") as file:
        file.write(trg_in_template)
    return


def run_trigrs(trg_inputs):
    # Correcting sign for `Alpha` parameters for saturated/unsaturated models
    for z in trg_inputs["geoparams"].keys():
        zone = trg_inputs["geoparams"][z]
        if "S" in trg_inputs["model"]:
            zone["α"] = -1 * abs(zone["α"])
        else:
            zone["α"] = abs(zone["α"])

    # Correcting sign for `mmax` parameters for finite/infinite models
    if "I" in trg_inputs["model"]:
        trg_inputs["mmax"] = -1 * abs(trg_inputs["mmax"])
    else:
        trg_inputs["mmax"] = abs(trg_inputs["mmax"])

    # Generating initializing file and running TRIGRS executable
    tr_in_maker(trg_inputs)  # Initializing files from template

    # remove TRgrid_size.txt file if exists
    path2TRgrid_size = f"./{project_name}/inputs/TRgrid_size.txt"
    if os.path.exists(path2TRgrid_size):
        os.remove(path2TRgrid_size)

    if trg_inputs["parallel"]:
        exe = f"./{project_name}/Exe_TRIGRS_par"
        _ = subprocess.run([f"chmod +x {exe}"], shell=True, capture_output=True, text=True)  # Change permission
        # out = subprocess.run(
        #     [f'mpirun -np {trg_inputs["NP"]} {exe}'], shell=True, capture_output=True, text=True
        # )  # Running TRIGRS executable
        with subprocess.Popen(
            [f'mpirun -np {trg_inputs["NP"]} {exe}'],
            stdout=subprocess.PIPE,
            stderr=subprocess.STDOUT,
            text=True
        ) as proceso:
            for linea in proceso.stdout:
                print(linea, end="")
    else:
        exe = f"./{project_name}/Exe_TRIGRS_ser"
        _ = subprocess.run([f"chmod +x {exe}"], shell=True, capture_output=True, text=True)  # Change permission
        # out = subprocess.run([exe], shell=True, capture_output=True, text=True)  # Running TRIGRS executable
        with subprocess.Popen(
            [exe],
            stdout=subprocess.PIPE,
            stderr=subprocess.STDOUT,
            text=True
        ) as proceso:
            for linea in proceso.stdout:
                print(linea, end="")
    return


def get_param(zone, param):
    return trg_inputs['geoparams'][zone.iloc[0]][param]

def get_df(file):
    γ_w = 9.8e3  # [N/m3] unit weight of water
    # Reading file
    df = pd.read_csv(file,
                     names=['i_tr', 'j_tr', 'elev', 'ψ', 'θ'],
                     skiprows=7, sep='\s+')#delim_whitespace=True)
    # Correcting indices to match numpy notation
    df['i'] = df['j_tr'].max() - df['j_tr']
    df['j'] = df['i_tr'] - 1
    df.drop(columns=['i_tr', 'j_tr'], inplace=True)
    # Calculating depths from elevations
    elev_max = df.groupby(['i', 'j'])['elev'].transform('max')
    df['z'] = elev_max - df['elev'] + 0.001
    df = df[['i', 'j', 'elev', 'z', 'ψ', 'θ']]
    # Assigning zones and geotechnical parameters
    df['zone'] = zones[df['i'], df['j']]
    for param_name in trg_inputs['geoparams'][1].keys():
        df[param_name] = df.groupby('zone')['zone'].transform(
            get_param, param=param_name)
    # Correting rows with ψ==0 (watertable) due to numerical errors
    mask = (df['ψ'] == 0) & (df['z'] > 0.001) & (df['θ'] == df['θ_sat'])
    # df.loc[mask, 'z'] = df.loc[mask, 'z'] + 1/df.loc[mask, 'α']
    # df.loc[mask, 'elev'] = df.loc[mask, 'elev'] - 1/df.loc[mask, 'α']
    # df.sort_values(['i', 'j', 'z'], inplace=True)
    df.drop(df[mask].index, inplace=True)  # This eliminates the wt rows
    # Assigning slope
    df['δ'] = slope[df['i'], df['j']]
    δrad = np.deg2rad(df['δ'])
    # Calculating effective stress parameter, χ
    df['χ'] = (df['θ'] - df['θ_res']) / (df['θ_sat'] - df['θ_res'])
    # Specific gravity
    df['Gs'] = (df['γ_sat']/γ_w - df['θ_sat']) / (1 - df['θ_sat'])
    # unit weight at unsat and sat zones
    df['γ_nat'] = (df['Gs'] * (1 - df['θ_sat']) + df['θ']) * γ_w
    # average unit weight
    γ_cumul = df.groupby(['i', 'j'])['γ_nat'].transform('cumsum')
    idx = df.groupby(['i', 'j'])['γ_nat'].cumcount() + 1
    df['γ_avg'] = γ_cumul / idx
    # Factor of safety
    fs1 = np.tan(np.deg2rad(df['φ'])) / np.tan(δrad)
    fs2_num = df['c'] - df['ψ'] * γ_w * df['χ'] * np.tan(np.deg2rad(df['φ']))
    fs2_den = df['γ_avg'] * df['z'] * np.sin(δrad) * np.cos(δrad)
    fs = fs1 + fs2_num/fs2_den
    fs[fs > 3] = 3
    df['fs'] = fs
    return df
<>:237: SyntaxWarning: invalid escape sequence '\s'
<>:237: SyntaxWarning: invalid escape sequence '\s'
/tmp/ipykernel_3635/93433982.py:237: SyntaxWarning: invalid escape sequence '\s'
skiprows=7, sep='\s+')#delim_whitespace=True)
Loading executables and input files
def download_file_from_github(file, url_path, output_path, make_executable=False):
    os.makedirs(output_path, exist_ok=True)
    destination = os.path.join(output_path, file)

    # ✅ Check if file already exists
    if os.path.exists(destination):
        print(f"🟡 File already exists at: {destination} — skipping download.")
        return

    url = f"{url_path.rstrip('/')}/{file}"

    try:
        print(f"⬇️ Downloading from: {url}")
        subprocess.run(["wget", "-q", "-O", destination, url], check=True)

        if make_executable:
            os.chmod(destination, 0o755)
            print(f"🔧 File marked as executable.")

        print(f"✅ File downloaded to: {destination}")
    except subprocess.CalledProcessError as e:
        print(f"❌ Download failed: {e}")


url_path = "https://raw.githubusercontent.com/eamontoyaa/data4testing/main/trigrs/"  # URL of the raw file on GitHub
output_path = "./{project_name}/"  # Path where you want to save the downloaded file
TopoIndex
file = "Exe_TopoIndex"  # Name of the file to download
download_file_from_github(file, url_path, os.path.join(os.getcwd(), project_name))
⬇️ Downloading from: https://raw.githubusercontent.com/eamontoyaa/data4testing/main/trigrs/Exe_TopoIndex
✅ File downloaded to: /mnt/d/OneDrive - Universidad EIA/EAMA/Dev/GitHub/EAFIT_slope_stability/notebooks/02_trigg_factors/ET260320/Exe_TopoIndex
TRIGRS
file = "Exe_TRIGRS_ser"  # Name of the file to download
download_file_from_github(file, url_path, os.path.join(os.getcwd(), project_name))
⬇️ Downloading from: https://raw.githubusercontent.com/eamontoyaa/data4testing/main/trigrs/Exe_TRIGRS_ser
✅ File downloaded to: /mnt/d/OneDrive - Universidad EIA/EAMA/Dev/GitHub/EAFIT_slope_stability/notebooks/02_trigg_factors/ET260320/Exe_TRIGRS_ser
# Check the files in the executables folder
os.listdir(exec_dir)
['Exe_TopoIndex', 'Exe_TRIGRS_ser', 'inputs', 'outputs']Running the TRIGRS model in a spatial domain
General inputs
model = "UF"  # Choose among UF, UI, SF, SI → | U: unsaturated | S: saturated | F: finite | I: infinite |

rainfall_mm_h = [1.08, 324.0]  # [mm/h] Rainfal intensities for each period.
duration_h = [0, 48, 60]  # [h] Rainfall duration for each period. Always starts at 0 and contains n+1 elements, where n is the number of rainfall intensity periods

output_times_h = [0.0, 12.0, 24.0, 28.0, 51.0, 60.0] # [h] Six output times between 0 and max(duration_h)
Units conversion
# Do not edit this cell!
rainfall_int =  np.array(rainfall_mm_h) / 36e5  # [mm/h] to [m/s]
cumul_duration = np.array(duration_h) * 3600  # [h] to [s]
output_times = np.array(output_times_h) * 3600 # [h] to [s]rainfall_intarray([3.e-07, 9.e-05])# Running TopoIndex
tpx_inputs = {
"flow_dir_scheme": 2, # 1 for ESRI, 2 for TopoIndex
"exponent_weight_fact": 25,
"iterarions": 10,
"proj_name": project_name[:8],
}
run_topoidx(tpx_inputs) TopoIndex: Topographic Indexing and
flow distribution factors for routing
runoff through Digital Elevation Models
By Rex L. Baum
U.S. Geological Survey
Version 1.0.14, 11May2015
-----------------------------------------
TopoIndex analysis - Project: ET260320
100 = number of data cells
100 = total number of cells
Reading elevation grid data
Initial elevation indexing completed
Finding D8 neighbor cells
nxtcel() nodata (integer,floating)= -9999 -9999.00000
Identifying downslope cells and grid mismatches
No grid mismatch found!
Correcting cell index numbers
Computing weighting factors
Saving results to disk
TRIGRS inputs
Do not edit those parameters with the → 🛇 ← symbol.
trg_inputs = {
    "proj_name": project_name[:8],  # Name of the project → 🛇 ←
    "model": model,  # S-saturated or U-unsaturated + F-finite or I-infinite → 🛇 ←
    "tx": 20, # [] tx*nper determines how many time steps are used in the computations → 🛇 ←
    "nmax": 20,  # [] Ma number of roots 𝚲n and terms in series solutions for UNS.zone → 🛇 ←
    "mmax": 50,  # [] Max number of terms in series solution for FIN depth. If <0: INF depth → 🛇 ←
    "zones": n_zones,  # [] Number of zones
    "nzs": 10,  # [] Vertical increments until zmax → 🛇 ←
    "nper": len(rainfall_int),  # [-] Periods of rainfall (N) → 🛇 ←
    "t": cumul_duration[-1],  # [s] Elapsed time since the start of the storm (t) → 🛇 ←
    "zmax": -3.001,  # [m] Max. depth to compute Fs and Ψ (if <0 read from grid file) → 🛇 ←
    "depth": -2.4,  # [m] Water table depth (d) (if <0 read from grid file) → 🛇 ←
    "rizero": 1e-9,  # [m/s] Steady pre-storm and long-term infilt. (Izlt) (if <0 read from grid file)
    "geoparams":{
        1: {
            "c": 3.5e3,  # [Pa] soil cohesion for effective stress (c')
            "φ": 35,  # [deg] soil friction angle for effective stress (φ')
            "γ_sat": 22.0e3,  # [N/m3]  unit weight of soil (γs)
            "D_sat": 6.0e-6,  # [m2/s] Saturated hydraulic diffusivity (D0)
            "K_sat": 1.0e-7,  # [m/s] Saturated hydraulic conductivity (Ks)
            "θ_sat": 0.45,  # [-] Saturated water content (θs)
            "θ_res": 0.05,  # [-] Residual water content (θr)
            "α": 0.5,  # [1/m] Fitting parameter. If <0: saturated infiltration
        },
        2: {
            "c": 8e3,  # [Pa] soil cohesion for effective stress (c')
            "φ": 31,  # [deg] soil friction angle for effective stress (φ')
            "γ_sat": 22.0e3,  # [N/m3]  unit weight of soil (γs)
            "D_sat": 8.0e-4,  # [m2/s] Saturated hydraulic diffusivity (D0)
            "K_sat": 1.0e-4,  # [m/s] Saturated hydraulic conductivity (Ks)
            "θ_sat": 0.45,  # [-] Saturated water content (θs)
            "θ_res": 0.06,  # [-] Residual water content (θr)
            "α": 8,  # [1/m] Fitting parameter. If <0: saturated infiltration
        },
        # 3: {
        #     "c": 3.5e3,  # [Pa] soil cohesion for effective stress (c')
        #     "φ": 35,  # [deg] soil friction angle for effective stress (φ')
        #     "γ_sat": 22.0e3,  # [N/m3]  unit weight of soil (γs)
        #     "D_sat": 6.0e-6,  # [m2/s] Saturated hydraulic diffusivity (D0)
        #     "K_sat": 1.0e-7,  # [m/s] Saturated hydraulic conductivity (Ks)
        #     "θ_sat": 0.45,  # [-] Saturated water content (θs)
        #     "θ_res": 0.05,  # [-] Residual water content (θr)
        #     "α": 0.5,  # [1/m] Fitting parameter. If <0: saturated infiltration
        # },
        # 4: {
        #     "c": 8e3,  # [Pa] soil cohesion for effective stress (c')
        #     "φ": 31,  # [deg] soil friction angle for effective stress (φ')
        #     "γ_sat": 22.0e3,  # [N/m3]  unit weight of soil (γs)
        #     "D_sat": 8.0e-4,  # [m2/s] Saturated hydraulic diffusivity (D0)
        #     "K_sat": 1.0e-4,  # [m/s] Saturated hydraulic conductivity (Ks)
        #     "θ_sat": 0.45,  # [-] Saturated water content (θs)
        #     "θ_res": 0.06,  # [-] Residual water content (θr)
        #     "α": 8,  # [1/m] Fitting parameter. If <0: saturated infiltration
        # }
    },
    "cri": tuple(rainfall_int),  # [m/s] Rainfall intensities  (Inz) → 🛇 ←
    "capt": tuple(cumul_duration),  # [s] Cumulative duration of rainfall cri[i] → 🛇 ←
    "flowdir": "gener",  # Method for maximum allowed Ψ ("gener", "slope", or "hydro")) → 🛇 ←
    "n_outputs": len(output_times),  # [-] No of raster outputs at different t → 🛇 ←
    "t_n_outputs": tuple(output_times),#t,  # [s] Time at which to save raster files → 🛇 ←
    "ψ_flag": -4, # → 🛇 ←
    "parallel": False,  # [-] Run in parallel → 🛇 ←
    "NP" : 4, # Number of processors → 🛇 ←
    # "inz_n_outputs": inz_n_outputs #inz,  # [s] Rainfall intensities at which to save raster files
}

run_trigrs(trg_inputs)
 TRIGRS: Transient Rainfall Infiltration
 and Grid-based Regional Slope-Stability
                Analysis
        Version 2.1.00c, 02 Feb 2022
   By Rex L. Baum and William Z. Savage
        U.S. Geological Survey
 -----------------------------------------

 Opening default initialization file
 TRIGRS, version 2.1.00c, (meter-kilogram-second-degrees units)
 Unsaturated infiltration model selected for cells in zone           1 .
 Unsaturated infiltration model selected for cells in zone           2 .
 ******** Zone            1  *********
 Using saturated infiltration model to avoid
 early-time errors in unsaturated infiltration model.
 ******** Zone            2  *********
 Using unsaturated infiltration model.
 ********  ********  ********  *********
 ET260320/inputs/TIgrid_size.txt T
 Reading input grids
 Testing and adjusting steady infiltration rates
 Adjusted steady infiltration rate at            0  cells
 Starting runoff-routing computations
 Initial size of time-steps    5400.0000000000000
 outp_incr_min    14400.0000
 Adjusted size of time-steps, tx    5400.0000000000000               20
 ******** Output times ********
 number, timestep #,  time
           1           1   0.00000000
           2           9   43200.0000
           3          17   86400.0000
 One or more specified output times unavailable,
 Nearest available time substituted.
           4          19   97200.0000
 One or more specified output times unavailable,
 Nearest available time substituted.
           5          35   183600.000
 One or more specified output times unavailable,
 Nearest available time substituted.
           6          41   216000.000
 Starting computations of pressure head and factor of safety
 Calling unsaturated finite-depth model
 Starting coupled saturated & unsaturated zone
 computations for finite-depth saturated zone
 Cells completed:
           0
         100  cells completed
 Saving results
 TRIGRS finished!
Note: The following floating-point exceptions are signalling: IEEE_UNDERFLOW_FLAG IEEE_DENORMAL
STOP 0
Visualizing spatial outputs of FS
def read_time(file):
    with open(file, 'r') as file:
        lines = file.readlines()
        time = float(lines[4].split()[-1])
    return time

actual_output_times = []
for i in range(1, trg_inputs["n_outputs"]+1):
    time = read_time(f'{outputs_dir}/TR_ijz_p_th_{project_name[:8]}_{i}.txt')
    actual_output_times.append(time)

actual_output_times, list(output_times)
([0.0, 43200.0, 86400.0, 97200.0, 183600.0, 216000.0],
[np.float64(0.0),
np.float64(43200.0),
np.float64(86400.0),
np.float64(100800.0),
np.float64(183600.0),
np.float64(216000.0)])norm = mpl.colors.Normalize(vmin=1, vmax=1.6) # Modify vmin and vmax based on your data range
cmap = mpl.cm.RdYlGn
# cmap.set_under('xkcd:reddish brown') # Set color for values below vmin
cmap.set_under('0.3') # Set color for values below vmin
cmapLoading...
n_subplots = len(actual_output_times)
nrows=np.ceil(n_subplots/3).astype(int)

if resample_data:
    hsd = get_hillshade(dem_rs, sun_azimuth=000, sun_altitude=30, cellsize=target_cellsize)


fig, axs = plt.subplots(ncols=3, nrows=nrows, figsize=(10, 3*nrows), layout='constrained', sharex=True, sharey=True)
all_fs = []
for i, t in enumerate(actual_output_times):
    fs_output_file = f"{outputs_dir}/TRfs_min_{project_name[:8]}_{i+1}.asc"
    fs, header = load_ascii_raster(fs_output_file)
    all_fs.append(fs)
    ax = axs[i//3, i%3]
    im_hsd = ax.matshow(hsd, cmap="gray", interpolation="none")
    im_fs = ax.matshow(fs, cmap=cmap, alpha=0.7, norm=norm)

    ax.set_title(f"FS at $t={t/3600:.1f}$ h", fontsize='x-large')

for ax in axs.flatten():
    # ax.images[1].set_clim(vmin=min_fs, vmax=max_fs)
    ax.xaxis.set_ticks_position('bottom') if ax.get_subplotspec().is_last_row() else None

cbar = fig.colorbar(im_fs, ax=axs, orientation='vertical', shrink=0.75, pad=0.01, extend='both')
cbar.ax.tick_params(axis="y", labelrotation=90, pad=1.5)
cbar.set_label('FS', rotation=90, size="x-large")
[label.set_va("center") for label in cbar.ax.get_yticklabels()]
fig.canvas.header_visible = False
fig.canvas.toolbar_position = 'bottom'
plt.show()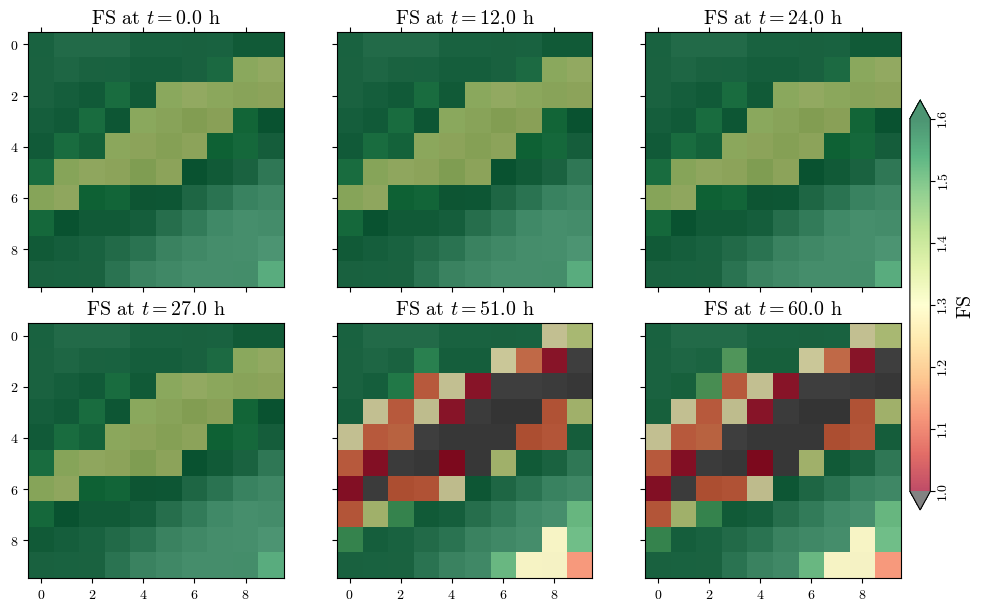
Visualizing spatial outputs of 
n_subplots = len(actual_output_times)
nrows=np.ceil(n_subplots/3).astype(int)

fig, axs = plt.subplots(ncols=3, nrows=nrows, figsize=(10, 3*nrows), layout='constrained', sharex=True, sharey=True)
all_psi = []
for i, t in enumerate(actual_output_times):
    psi_output_file = f"{outputs_dir}/TRp_at_fs_min_{project_name[:8]}_{i+1}.asc"
    psi, header = load_ascii_raster(psi_output_file)
    all_psi.append(psi)
    ax = axs[i//3, i%3]
    im_hsd = ax.matshow(hsd, cmap="gray", interpolation="none")
    im_psi = ax.matshow(psi, cmap='ocean_r', alpha=0.7, interpolation="none")#, vmin=0, vmax=np.nanmax(depth))

    ax.set_title(f"$\\psi$ at $t={t/3600:.1f}$ h", fontsize='x-large')
    ax.set_xticks([])
    ax.set_yticks([])

min_psi, max_psi = np.nanmin(all_psi), np.nanmax(all_psi)  # change vmin and vmax to each subplot
for ax in axs.flatten():
    ax.images[1].set_clim(vmin=min_psi, vmax=max_psi)
    ax.xaxis.set_ticks_position('bottom') if ax.get_subplotspec().is_last_row() else None

cbar = fig.colorbar(im_psi, ax=axs, orientation='vertical', shrink=0.75, pad=0.01)
cbar.ax.tick_params(axis="y", labelrotation=90, pad=1.5)
cbar.set_label('Pressure head, $\\psi$  [m]', rotation=90, size="x-large")
[label.set_va("center") for label in cbar.ax.get_yticklabels()]
fig.canvas.header_visible = False
fig.canvas.toolbar_position = 'bottom'
plt.show()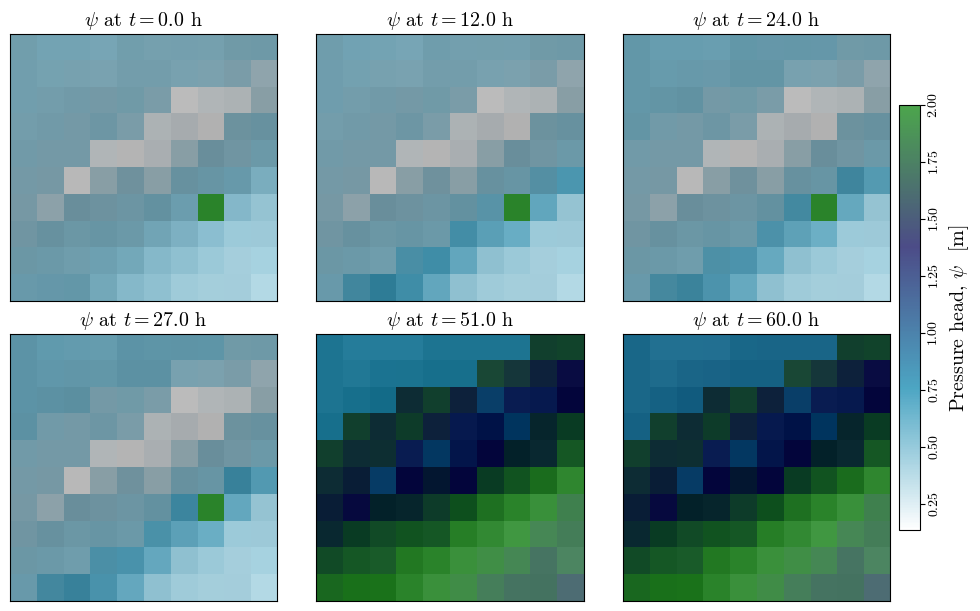
Output to dataframe
def get_param(zone, param):
    return trg_inputs['geoparams'][zone.iloc[0]][param]

def get_df(file):
    γ_w = 9.8e3  # [N/m3] unit weight of water
    # Reading file
    df = pd.read_csv(file, names=['i_tr', 'j_tr', 'elev', 'ψ', 'θ'], skiprows=7, sep='\s+')
    # Correcting indices to match numpy notation
    df['i'] = df['j_tr'].max() - df['j_tr']
    df['j'] = df['i_tr'] - 1
    df.drop(columns=['i_tr', 'j_tr'], inplace=True)
    # Calculating depths from elevations
    elev_max = df.groupby(['i', 'j'])['elev'].transform('max')
    df['z'] = elev_max - df['elev'] + 0.001
    df = df[['i', 'j', 'elev', 'z', 'ψ', 'θ']]
    # Assigning zones and geotechnical parameters
    df['zone'] = zones[df['i'], df['j']]
    for param_name in trg_inputs['geoparams'][1].keys():
        df[param_name] = df.groupby('zone')['zone'].transform(get_param, param=param_name)
    # Correting rows with ψ==0 (watertable) due to numerical errors
    mask = (df['ψ'] == 0) & (df['z'] > 0.001) & (df['θ'] == df['θ_sat'])
    # df.loc[mask, 'z'] = df.loc[mask, 'z'] + 1/df.loc[mask, 'α']
    # df.loc[mask, 'elev'] = df.loc[mask, 'elev'] - 1/df.loc[mask, 'α']
    # df.sort_values(['i', 'j', 'z'], inplace=True)
    df.drop(df[mask].index, inplace=True)  # This eliminates the wt rows
    # Assigning slope
    df['δ'] = slope[df['i'], df['j']]
    δrad = np.deg2rad(df['δ'])
    # Calculating effective stress parameter, χ
    df['χ'] = (df['θ'] - df['θ_res']) / (df['θ_sat'] - df['θ_res'])
    # Specific gravity
    df['Gs'] = (df['γ_sat']/γ_w - df['θ_sat']) / (1 - df['θ_sat'])
    # unit weight at unsat and sat zones
    df['γ_nat'] = (df['Gs'] * (1 - df['θ_sat']) + df['θ']) * γ_w
    # average unit weight
    γ_cumul = df.groupby(['i', 'j'])['γ_nat'].transform('cumsum')
    idx = df.groupby(['i', 'j'])['γ_nat'].cumcount() + 1
    df['γ_avg'] = γ_cumul / idx
    # Factor of safety
    fs1 = np.tan(np.deg2rad(df['φ'])) / np.tan(δrad)
    fs2_num = df['c'] - df['ψ'] * γ_w * df['χ'] * np.tan(np.deg2rad(df['φ']))
    fs2_den = df['γ_avg'] * df['z'] * np.sin(δrad) * np.cos(δrad)
    fs = fs1 + fs2_num/fs2_den
    fs[fs > 3] = 3
    df['fs'] = fs
    return df
<>:7: SyntaxWarning: invalid escape sequence '\s'
<>:7: SyntaxWarning: invalid escape sequence '\s'
/tmp/ipykernel_3635/3828251152.py:7: SyntaxWarning: invalid escape sequence '\s'
  df = pd.read_csv(file, names=['i_tr', 'j_tr', 'elev', 'ψ', 'θ'], skiprows=7, sep='\s+')
Verification of FS and head pressure at a point
cell = (2, 2)  # (i, j) indices of the unique cell in the domain (i=y, j=x) in numpy notation

file = f'{outputs_dir}/TR_ijz_p_th_{project_name[:8]}_4.txt'
df = get_df(file)
cell_df = df[(df['i']==cell[0]) & (df['j']==cell[1])]
# cell_df.drop(cell.index[cell['ψ'] == 0], inplace=True)
cell_df.head()
Loading...
Plotting results at a point
clrs = ['#6F4C9B', '#6059A9', '#5568B8', '#4E79C5', '#4D8AC6', '#4E96BC',
        '#549EB3', '#59A5A9', '#60AB9E', '#69B190', '#77B77D', '#8CBC68',
        '#A6BE54', '#BEBC48', '#D1B541', '#DDAA3C', '#E49C39', '#E78C35',
        '#E67932', '#E4632D', '#DF4828', '#DA2222']
cmap = mpl.colors.LinearSegmentedColormap.from_list('cmap_name', clrs)
# cmap
fig, axs = plt.subplots(nrows=1, ncols=2, figsize=(7, 4), sharey=True, layout='constrained')
palette = mpl.colormaps['gnuplot_r']
palette = cmap
for ax in axs:
ax.grid(True, color='0.3', ls='--', lw=0.7)
ax.spines["top"].set_linewidth(1.5)
ax.spines["left"].set_linewidth(1.5)
ax.xaxis.set_ticks_position('top')
ax.xaxis.set_tick_params(top=True, bottom=False)
ax.xaxis.set_label_position('top')
ax.set_prop_cycle('color', palette(np.linspace(0, 1, len(output_times))))
axs[0].axvline(0, color='k', lw=1.5, ls='--')
axs[1].axvline(1, color='k', lw=1.5, ls='--')
for n in np.arange(len(output_times)) + 1:
file = f'{project_name}/outputs/TR_ijz_p_th_{project_name[:8]}_{n}.txt'
t = read_time(file)
df = get_df(file)
df_cell = df[(df['i']==cell[0]) & (df['j']==cell[1])]
axs[0].plot(df_cell['ψ'], df_cell['z'], label=f'$t={t/3600:.0f}$ h')
axs[1].plot(df_cell['fs'], df_cell['z'], label=f'$t={t/3600:.0f}$ h')
axs[0].set(xlabel='Pressure head, $\\psi$ [m]', ylabel='$Z$ [m]')
axs[1].set(xlabel='FS')
axs[1].invert_yaxis()
handles, labels = axs[0].get_legend_handles_labels()
fig.legend(handles, labels, loc='outside right center')
fig.canvas.header_visible = False
fig.canvas.toolbar_position = 'bottom'
plt.show()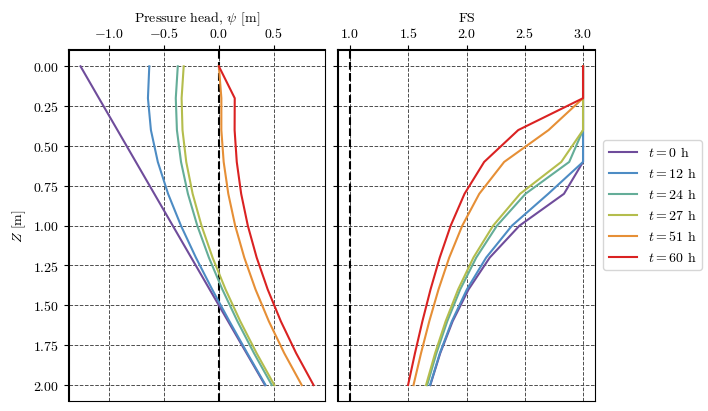
- Baum, R. L., Savage, W. Z., & Godt, J. W. (2002). TRIGRS—A Fortran Program for Transient Rainfall Infiltration and Grid-Based Regional Slope-Stability Analysis, Open file report 02-424 (p. 25) [Techreport]. U.S Geological Survey. 10.3133/ofr02424
- Baum, R. L., Savage, W. Z., & Godt, J. W. (2008). TRIGRS — A Fortran Program for Transient Rainfall Infiltration and Grid-Based Regional Slope-Stability Analysis, Version 2.0 (p. 75) [Techreport]. U.S Geological Survey. 10.3133/ofr20081159
- Alvioli, M., & Baum, R. L. (2016). Parallelization of the TRIGRS model for rainfall-induced landslides using the message passing interface. Environmental Modelling & Software, 81, 122–135. 10.1016/j.envsoft.2016.04.002